
Yan Liu, Qingwu Li, Guanying Huo, Jun Xing. Local Binary Description Combined with Superpixel Segmentation Refinement for Stereo Matching[J]. Acta Optica Sinica, 2018, 38(6): 0615003
- Acta Optica Sinica
- Vol. 38, Issue 6, 0615003 (2018)
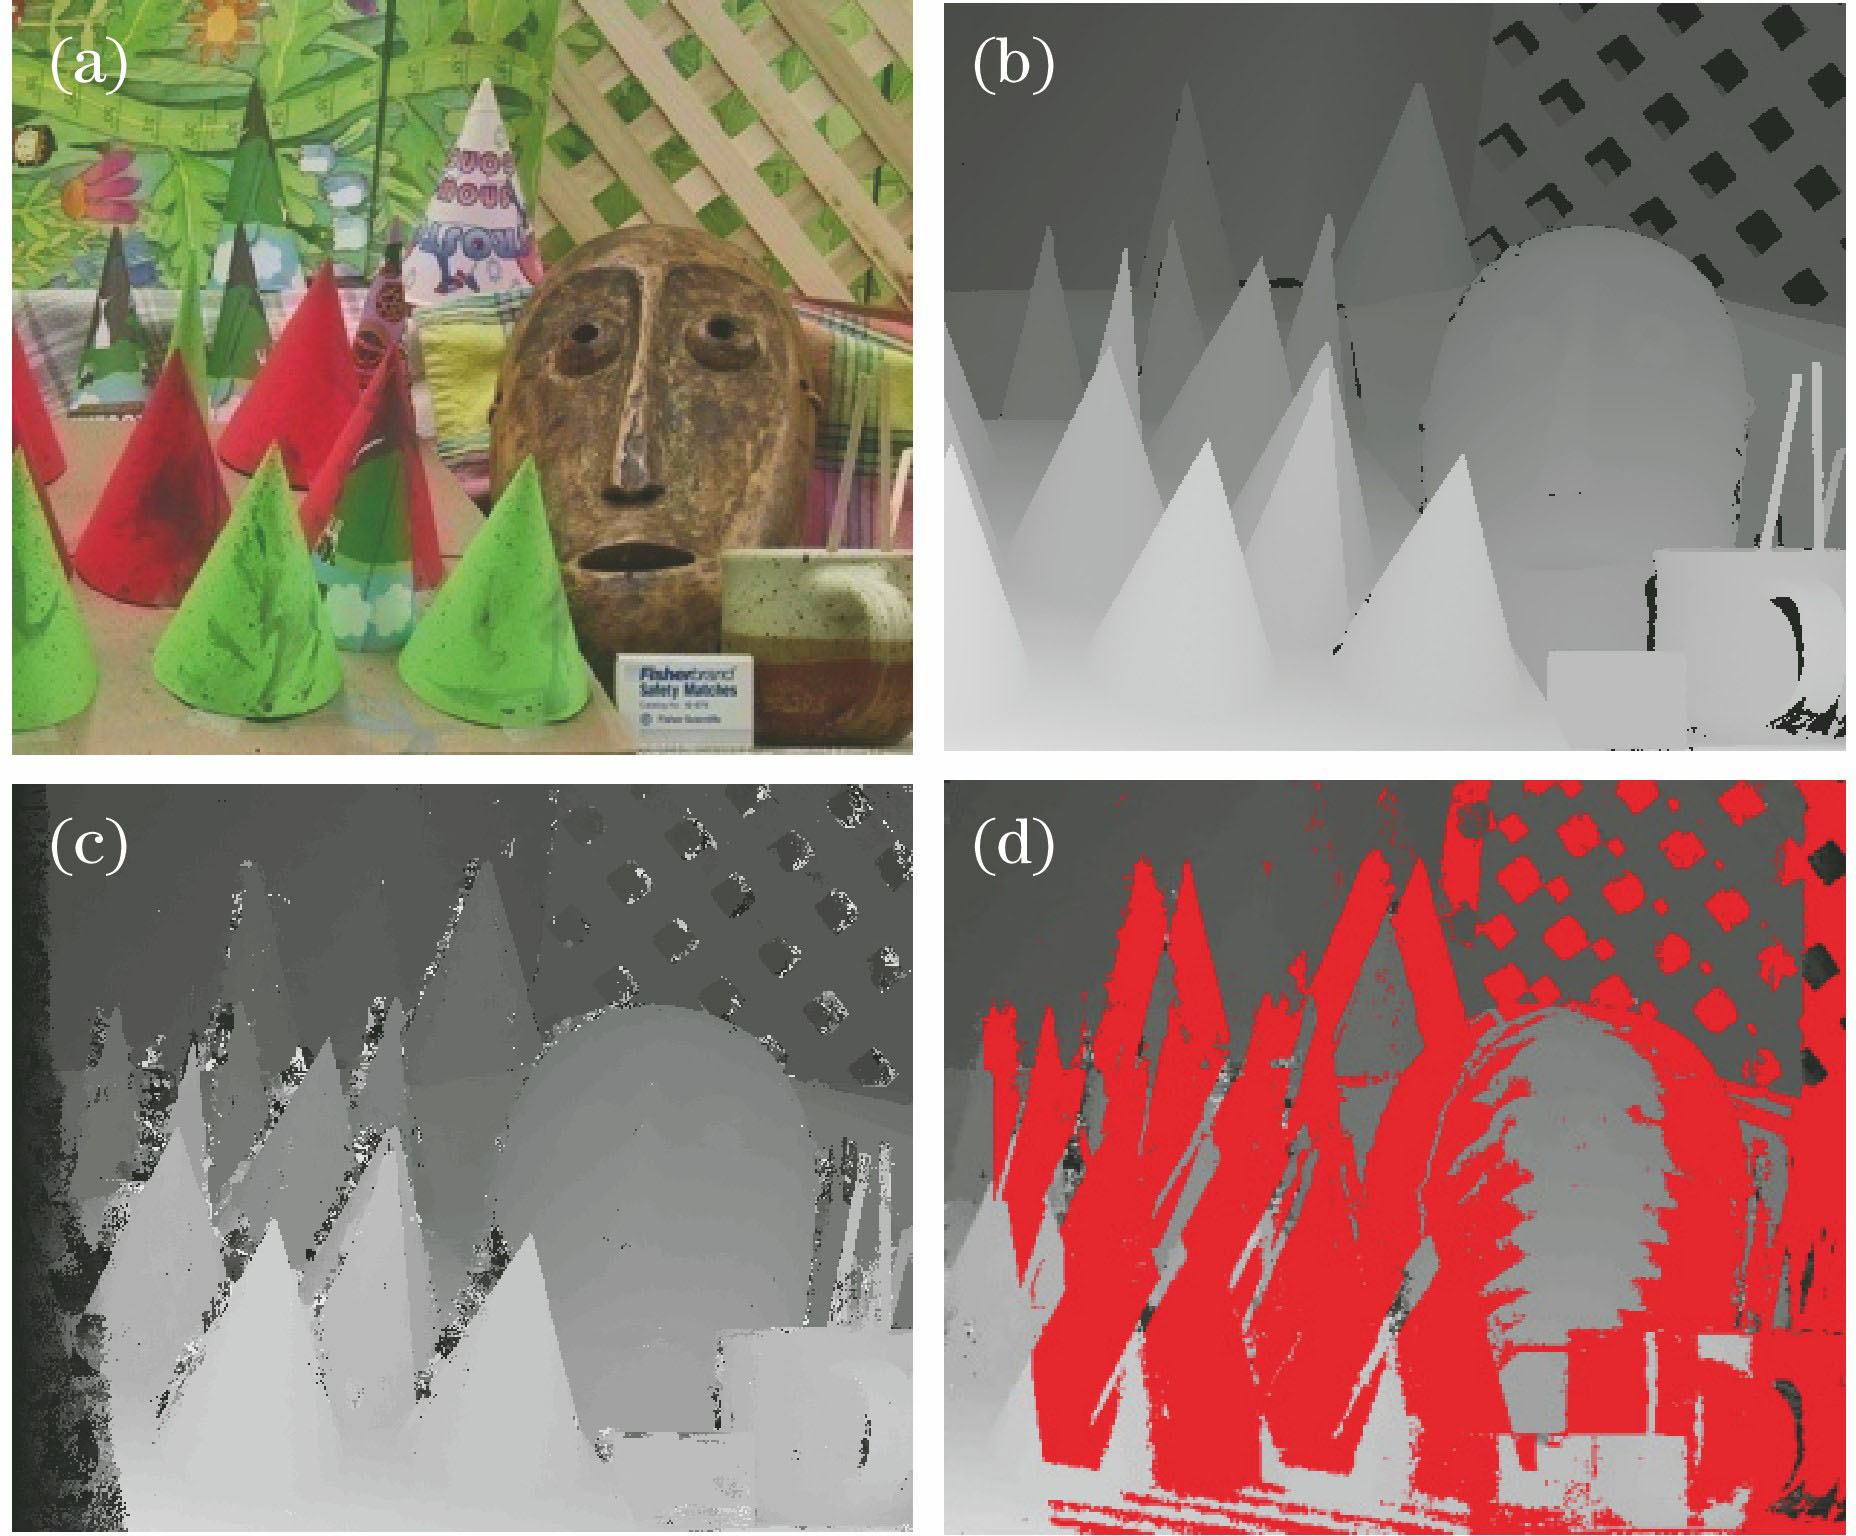
Fig. 1. Disparity images of Cones. (a) Left view of Cones; (b) true disparity image; (c) initial disparity image; (d) mismatching test result
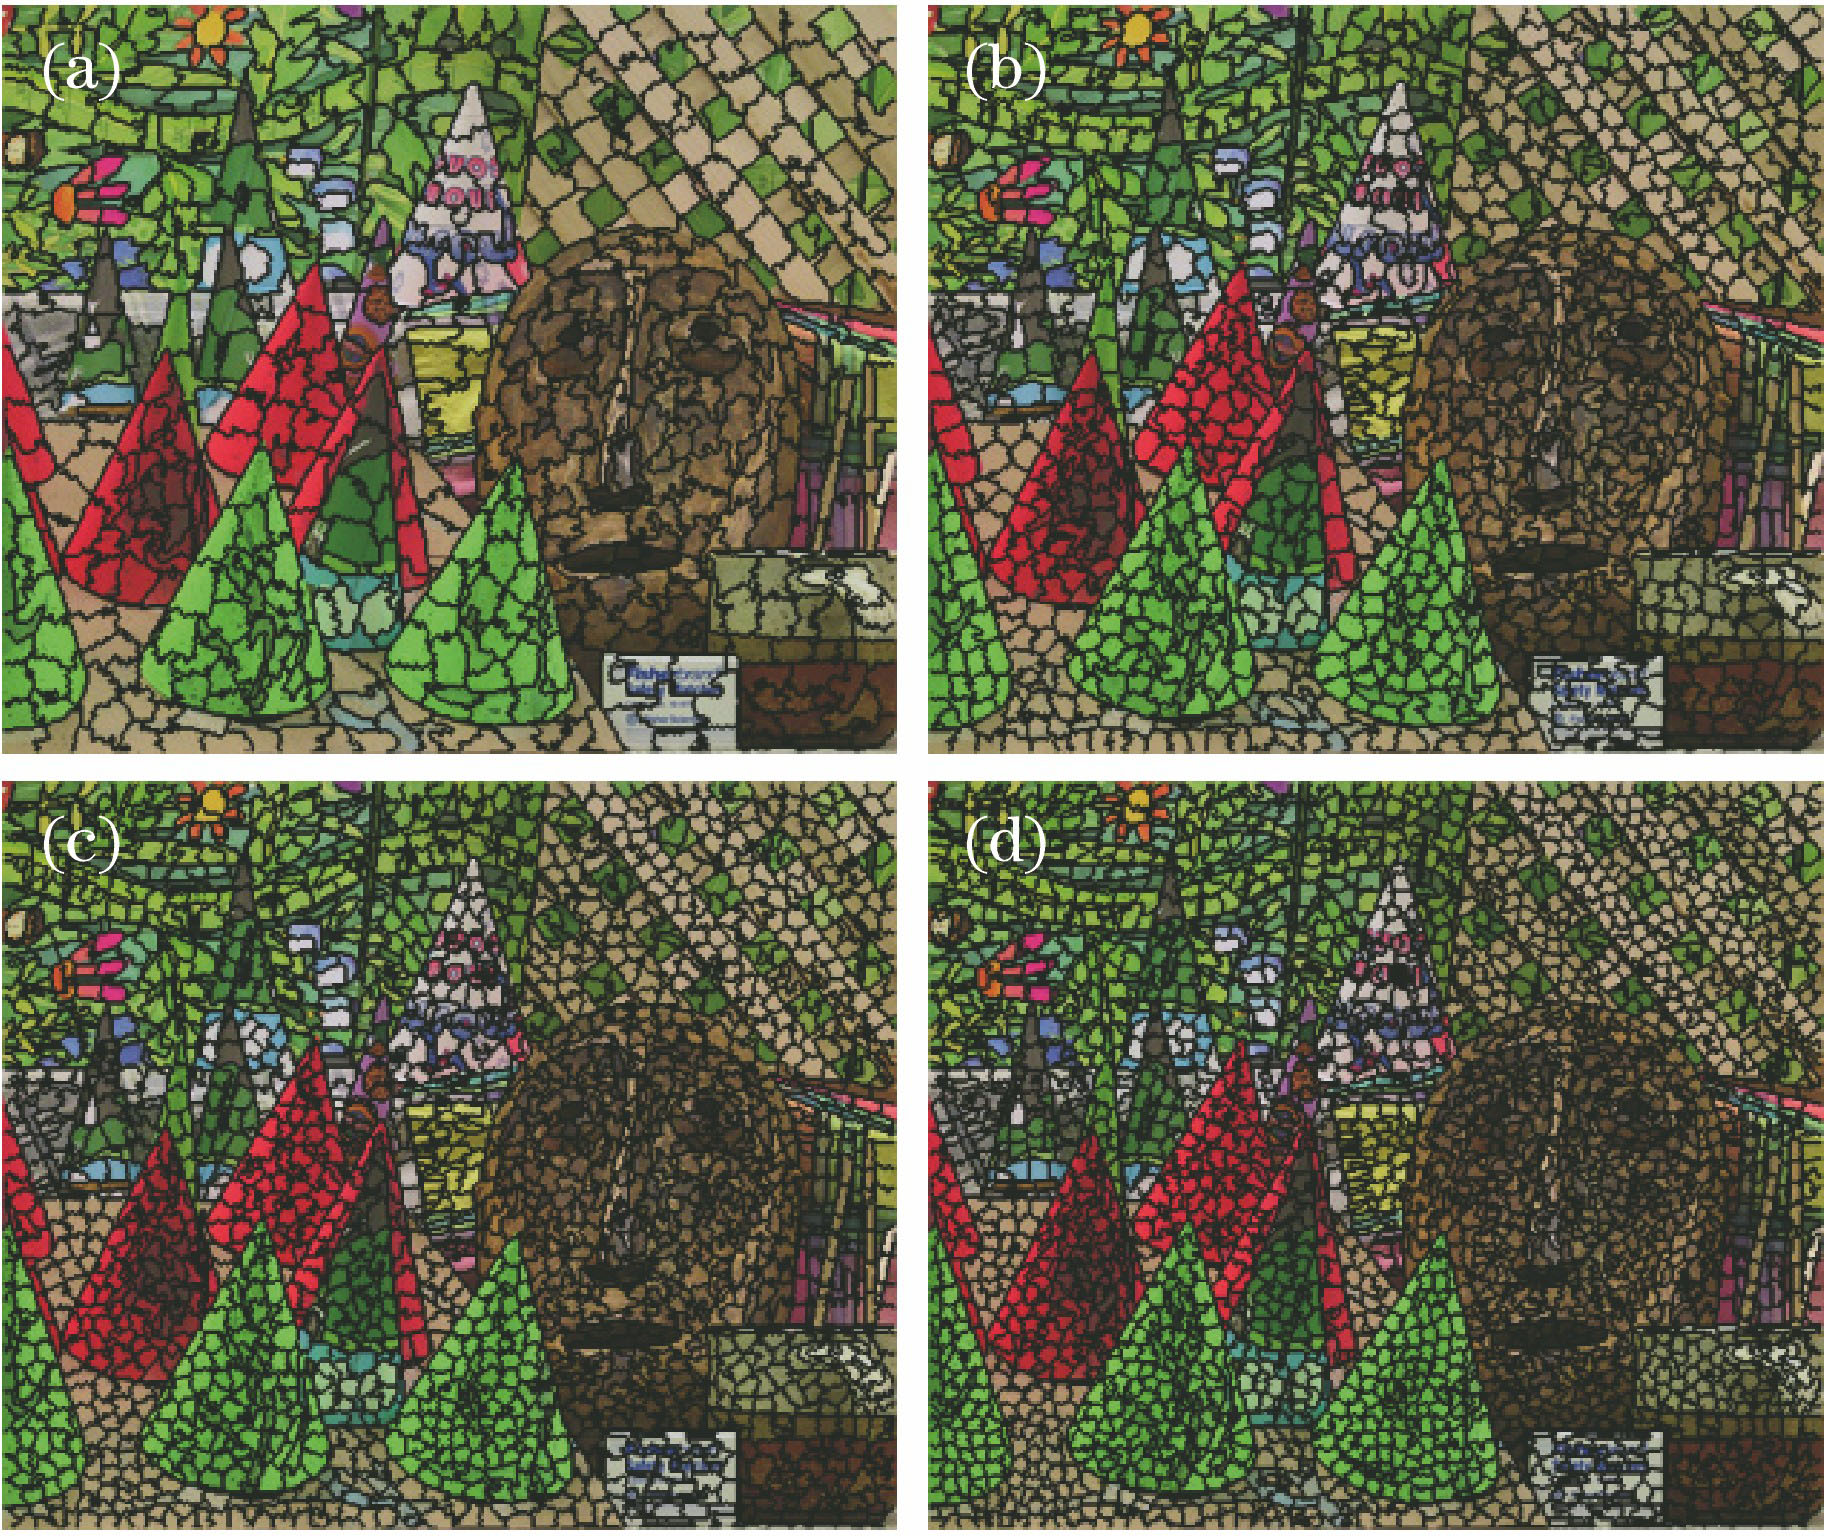
Fig. 2. Segmentation results for various numbers of superpixel. (a) M=800; (b) M=1600; (c) M=2400; (d) M=3200
Fig. 3. Comparison of initial disparity results. (a) Reference image; (b) Cencus method; (c) GD-Cencus method; (d) proposed method
Fig. 4. Effect of numbers of superpixel on the (a) speed and (b) quality
Fig. 5. Mismatching test result for Cones after disparity refinement. (a) MST method; (b) WCPSP method; (c) DR method; (d) proposed method
Fig. 6. Disparity images of non-overlapping region between reference image and match image. (a) Ground truth disparity image; (b) initial disparity image; disparity images using (c) MST method, (d) WCPSP method, (e) DR method and (f) proposed method
Fig. 7. Refinement results for Tsukuba, Venus, Teddy, and Cones. (a) Ground truth disparity; (b) MST method; (b) WCPSP method; (c) DR method; (d) proposed method
Fig. 8. Comparisons of error rates using WCPSP, BSM, ARW, and proposed method. (a) Percentage of bad pixel for non-occluded; (b) percentage of bad pixel for all
|
Table 1. Running time of four methods
| |||||||||||||||||||||||||||||||||||||||||||||||||||||||||||||||||||||||||||||||||||||||||||||||||||||||||||||||
Table 2. Comparison of error rate of optimization algorithm%

Set citation alerts for the article
Please enter your email address
© Copyright 2018-2021 | Chinese Laser Press. All Rights Reserved 沪ICP备15018463号-20