• Spectroscopy and Spectral Analysis
  • Vol. 41, Issue 7, 2205 (2021)
Xin-hua YU1、*, Wei-qing ZHAO2、2; *;, Zai-chun ZHU2、2;, Bao-dong XU3、3;, and Zhi-zhan ZHAO4、4;
Author Affiliations
  • 11. State Key Laboratory of Earth Surface Processes and Resource Ecology, Faculty of Geographical Science, Beijing Normal University, Beijing 100875, China
  • 22. School of Urban Planning and Design, Shenzhen 518055, China
  • 33. College of Resources and Environmental Sciences/Macro Agriculture Research Institute Huazhong Agricultural University, Wuhan 430070, China
  • 44. School of Atmospheric Science, Nanjing University, Nanjing 210023, China
  • show less
    DOI: 10.3964/j.issn.1000-0593(2021)07-2205-07 Cite this Article
    Xin-hua YU, Wei-qing ZHAO, Zai-chun ZHU, Bao-dong XU, Zhi-zhan ZHAO. Research in Crop Yield Estimation Models on Different Scales Based on Remote Sensing and Crop Growth Model[J]. Spectroscopy and Spectral Analysis, 2021, 41(7): 2205 Copy Citation Text show less
    Overview of the study area
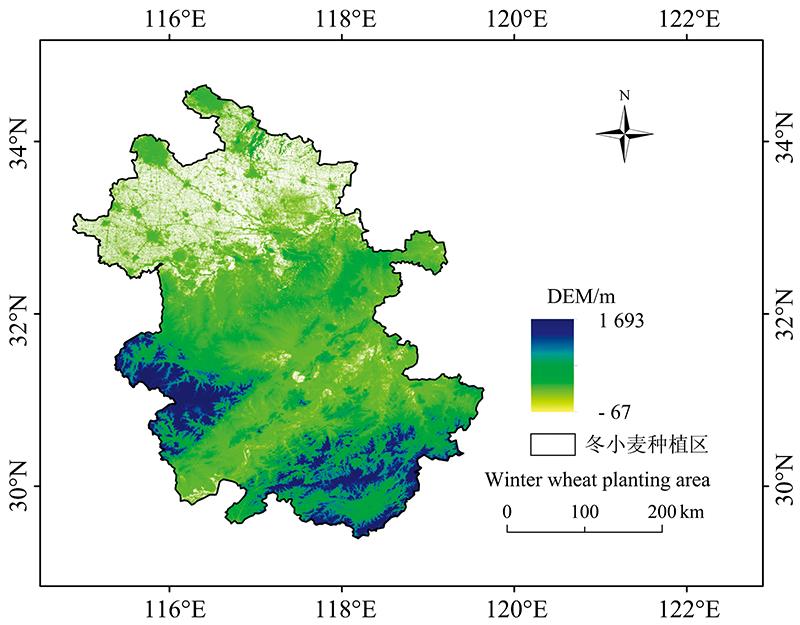
    Fig. 1. Overview of the study area
    Comparison of WOFOST simulated yield with site-measured yield
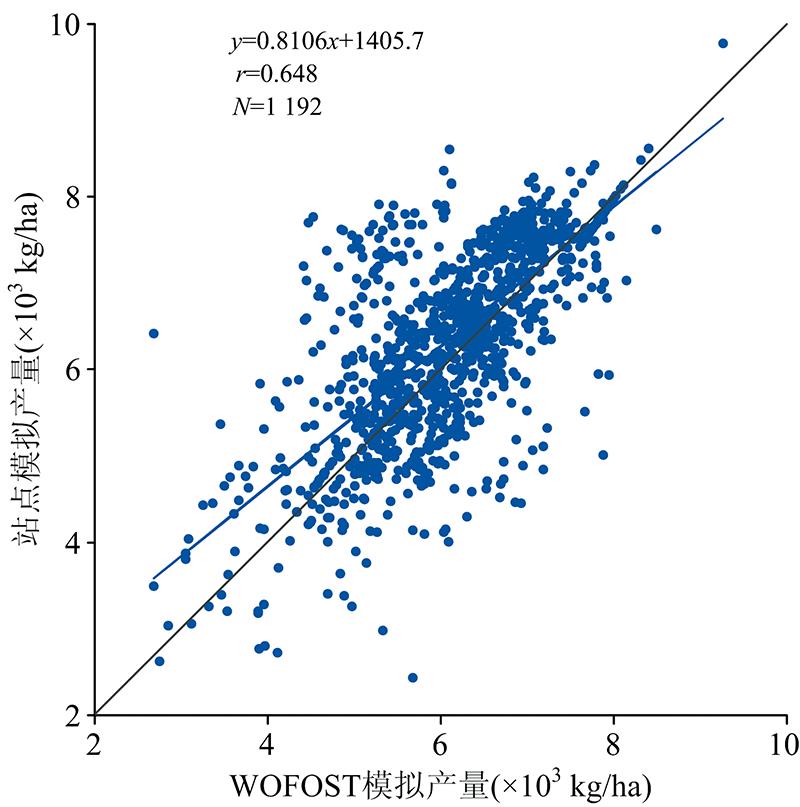
    Fig. 2. Comparison of WOFOST simulated yield with site-measured yield
    LAI (a) and WSO (b) daily outputs from 50 random simulations of the WOFOST
    Fig. 3. LAI (a) and WSO (b) daily outputs from 50 random simulations of the WOFOST
    The coefficient of determination (R2) for the Random Forests models based on simulated LAI and monthly weather
    Fig. 4. The coefficient of determination (R2) for the Random Forests models based on simulated LAI and monthly weather
    Comparison of SCYM estimated yield with site-measured yield
    Fig. 5. Comparison of SCYM estimated yield with site-measured yield
    Spatial distribution of relative error between the SCYM estimated yield and the site-measured yield
    Fig. 6. Spatial distribution of relative error between the SCYM estimated yield and the site-measured yield
    Average SCYM estimated yield in 2012—2018
    Fig. 7. Average SCYM estimated yield in 2012—2018
    Trend of winter wheat yield in Anhui Province
    Fig. 8. Trend of winter wheat yield in Anhui Province
    参数名称定义单位取值范围
    TSUM1出苗至开花有效积温℃·d600.0~1 500.0
    TSUM2开花至成熟有效积温℃·d500.0~1 200.0
    IDSOW播种日期d273~313
    TDWI初始生物量kg·hm-2100~210
    SPAN叶片衰老系数d21~41
    LAIEM出苗时叶面积指数hm-2·hm-20.136 5
    CVL叶生长同化物转化效率kg·kg-10.485~0.685
    CVO贮存器官生长同化物转化效率kg·kg-10.729~0.81
    CVR根同化物转化效率kg·kg-10.694
    CVS茎同化物转化效率kg·kg-10.662~0.762
    EFFTB对应生育期单片光能利用效率kg·hm-2·h-1·J-1·m-2·s-10.35~0.5
    AMAX01(DVS=0.00)
    AMAX02(DVS=1.00)
    AMAX03(DVS=1.30)
    AMAX04(DVS=2.00)
    叶片最大CO2同化速率kg·hm-235.83
    38.83
    30~35.83
    4.48
    SLA01(DVS=0.00)
    SLA02(DVS=0.50)
    SLA03(DVS=2.00)
    比叶面积hm2·kg-10.001 25~0.002 12
    0.001 35~0.002 75
    0.0~0.001 5
    Table 1. Range of calibrated values of maincrop parameters of WOFOST model
    天气变量待选指标
    平均气温/℃12月平均气温
    1月平均气温
    2月平均气温
    12月—2月平均气温
    3月—5月平均气温
    平均最低气温/℃12月平均最低气温
    1月平均最低气温
    2月平均最低气温
    12月—2月平均最低气温
    降水量/mm越冬前降水量
    返青期降水量
    拔节期降水量
    抽穗扬花期降水量
    灌浆期降水量
    全生育期总降水量
    太阳辐射/(kJ·m-2)灌浆期太阳辐射
    3月太阳辐射
    4月太阳辐射
    5月太阳辐射
    3月—5月平均太阳辐射
    饱和水汽压差/kPa3月平均饱和水汽压差
    4月平均饱和水汽压差
    5月平均饱和水汽压差
    3月—5月平均饱和水汽压差
    有效活动积温/℃播种—越冬期积温
    返青—成熟期积温
    全生育期积温
    越冬期负积温
    Table 2. Seasonal meteorological weather indicators to be selected
    Xin-hua YU, Wei-qing ZHAO, Zai-chun ZHU, Bao-dong XU, Zhi-zhan ZHAO. Research in Crop Yield Estimation Models on Different Scales Based on Remote Sensing and Crop Growth Model[J]. Spectroscopy and Spectral Analysis, 2021, 41(7): 2205
    Download Citation