
Zhao Li, Zengguang Qin, Zhaojun Liu, Yanping Xu, Zhenhua Cong, Shuai Qu. Phase-Sensitive Optical Time Domain Reflectometry Assisted by Total Variation Techniques[J]. Acta Optica Sinica, 2021, 41(17): 1706001
- Acta Optica Sinica
- Vol. 41, Issue 17, 1706001 (2021)
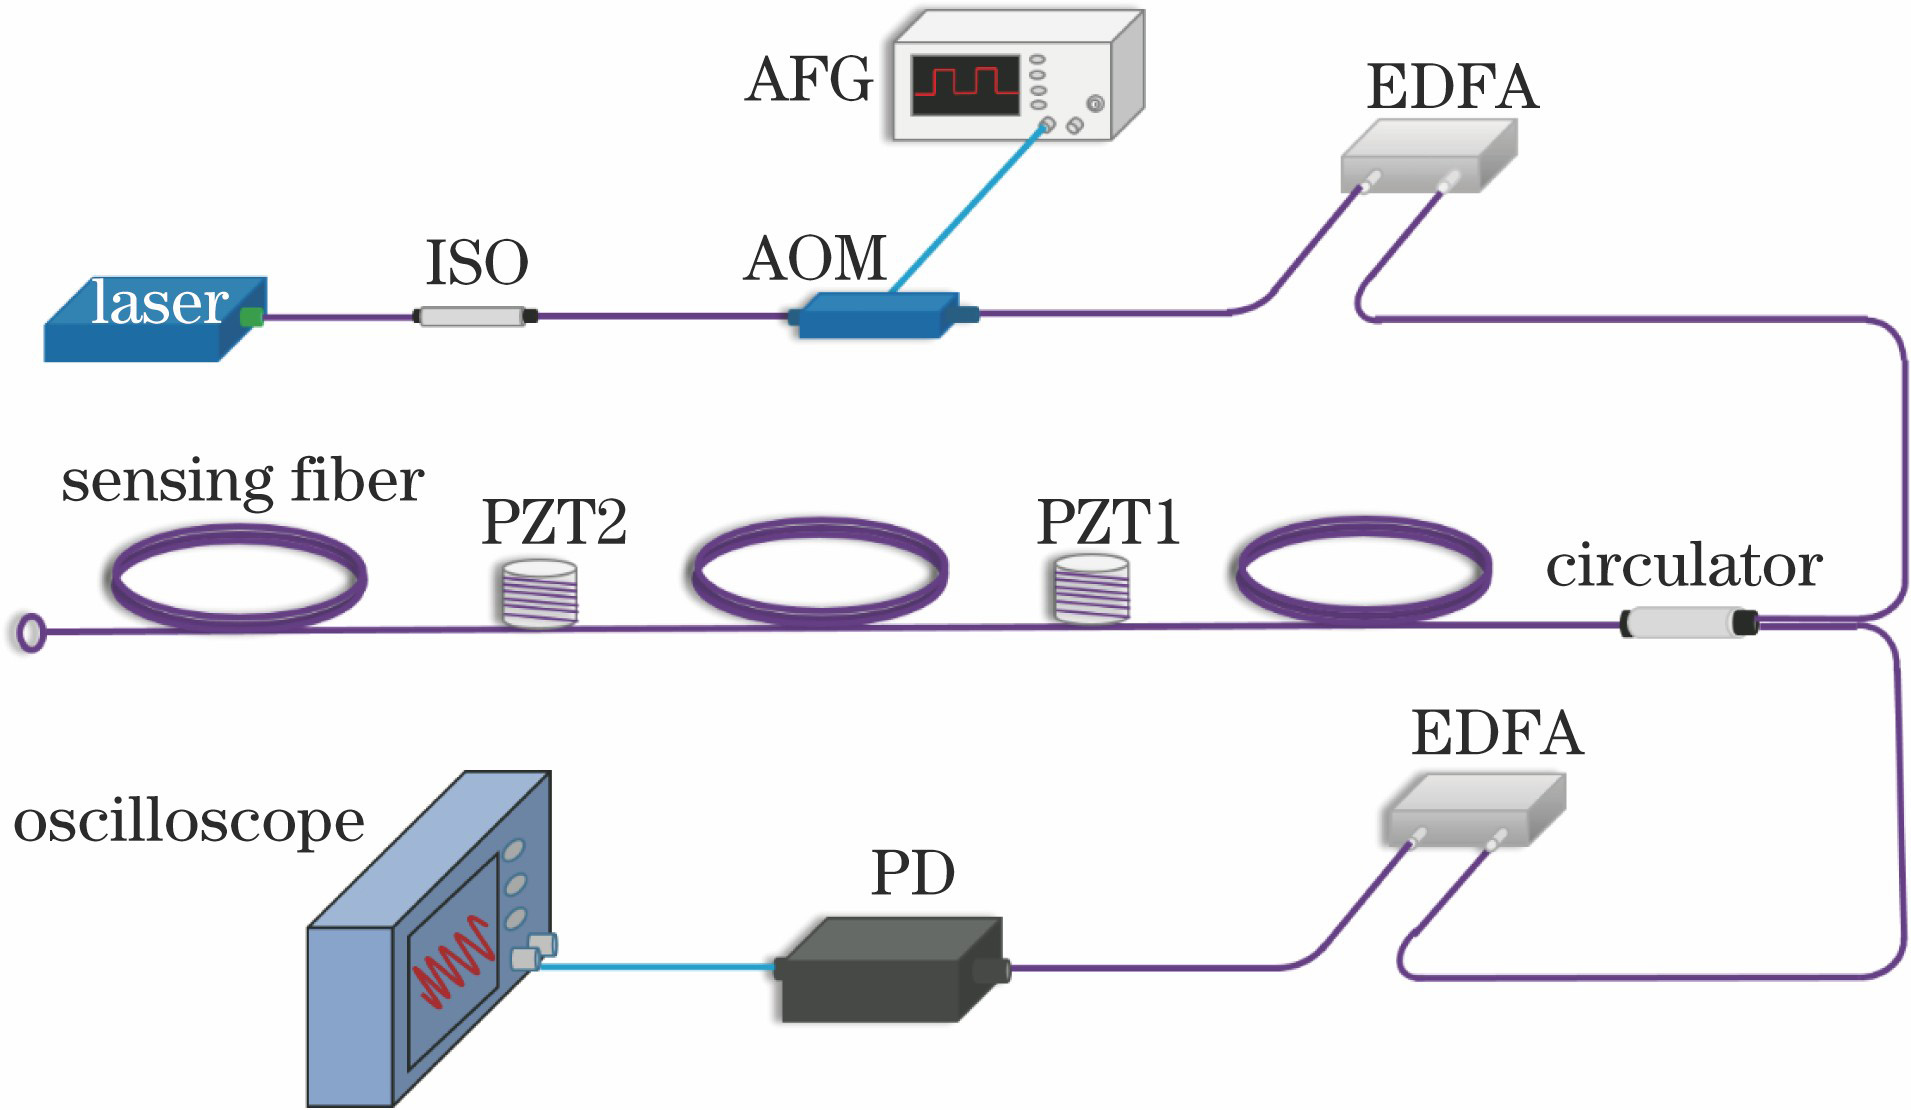
Fig. 1. Experimental setup of φ-OTDR system
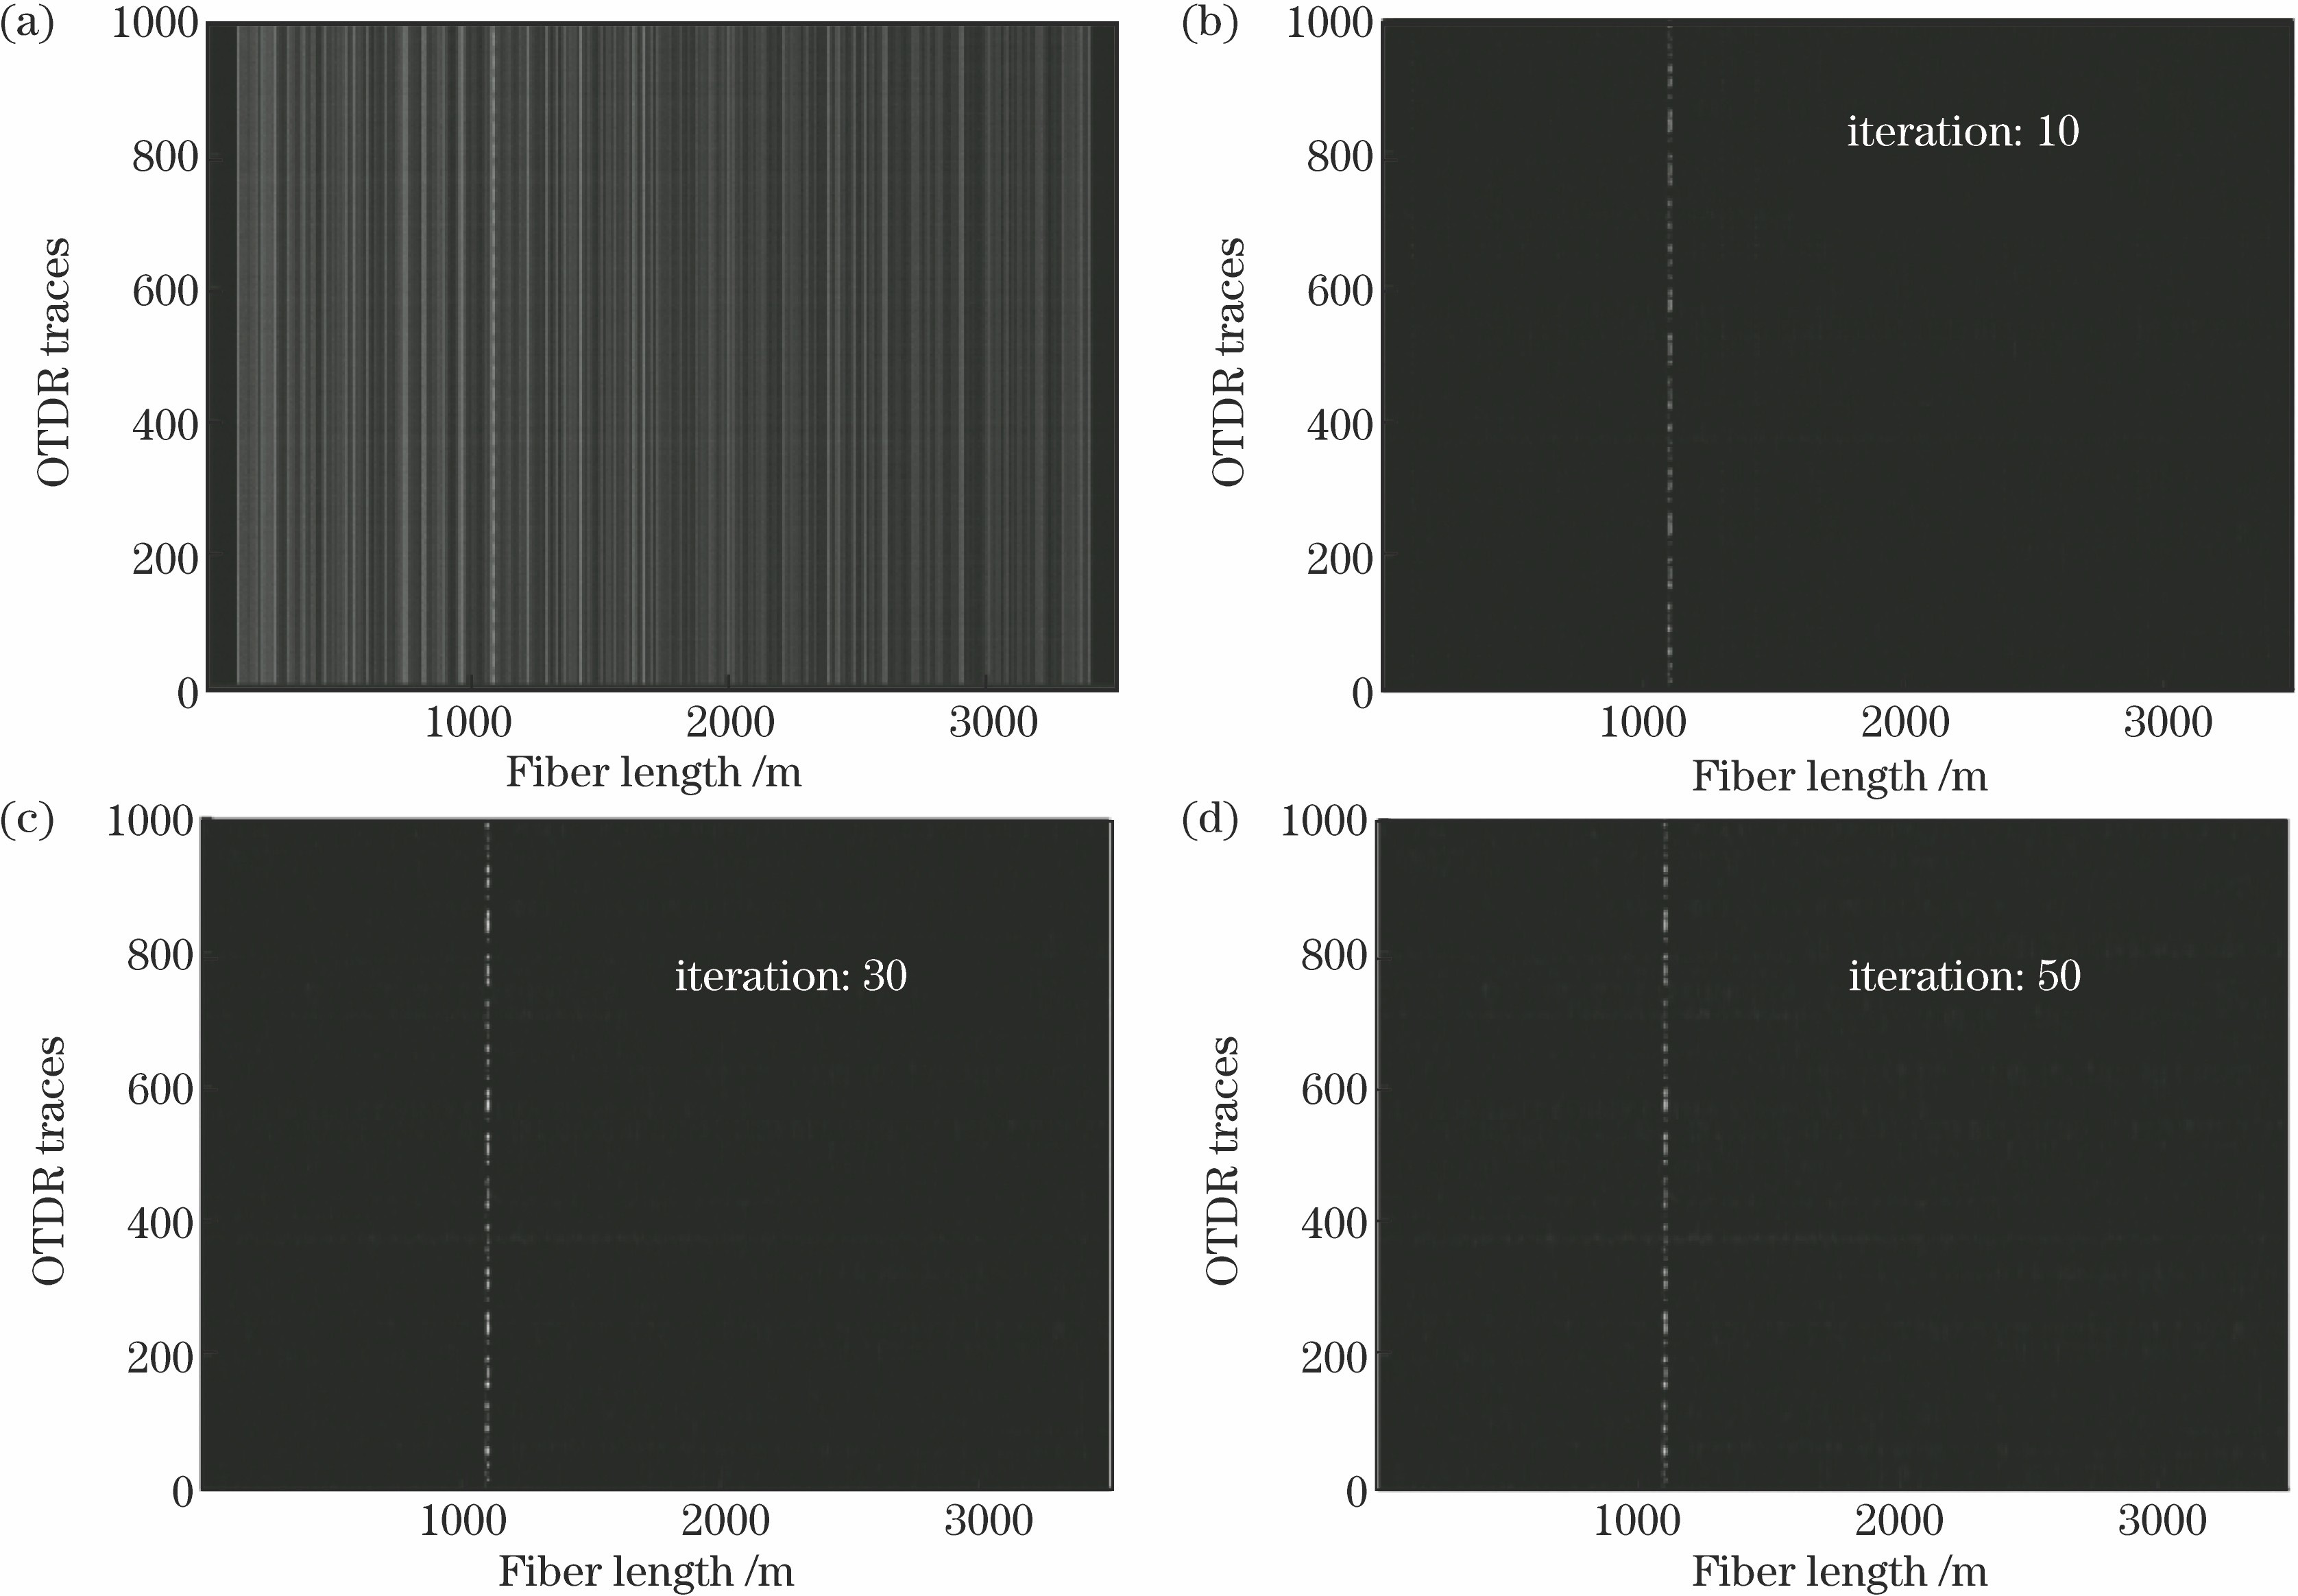
Fig. 2. Gray scale transformation and iterative operation of original signal. (a) Original gray image constructed via consecutive Rayleigh curves; denoised gray images with single bright line indicating position information obtained after different iteration times, (b) 10 iteration times, (c) 30 iteration times, (d) 50 iteration times
Fig. 3. Location of original signal and after different iteration times. (a) Original Rayleigh backscattering traces; position information obtained after different iteration times, (b) 10 iteration times, (c) 30 iteration times, (d) 50 iteration times
Fig. 4. Vibration detection of 300 Hz processed by different denoising methods. (a) Moving average and moving differential method; (b) nonlocal mean method; (c) total variation algorithm
Fig. 5. Spatial resolution of the three methods. (a) Moving average and moving differential method; (b) nonlocal mean method; (c) total variation method
Fig. 6. Frequency information of the vibration event at PZT1
Fig. 7. Location information for detection of two PZTs’ vibrations by different methods. (a) Moving average and moving differential method; (b) nonlocal mean method; (c) total variation algorithm
Fig. 8. Frequency information for the vibration events. (a) PZT1; (b) PZT2
Fig. 9. Results of total variation algorithm for wideband signal processing. (a) Location information of vibration; (b) information of wideband signal spectral

Set citation alerts for the article
Please enter your email address
© Copyright 2018-2021 | Chinese Laser Press. All Rights Reserved 沪ICP备15018463号-20