
Huijuan Tian, Yang Hu, Tao Chen, Jianxin Liu, Minpeng Cai, Tao Guan. Spectral Optimization of a Mixed White Light-Emitting Diode (LED) Cluster Comprising a Red/Green/Blue/Cyan/Yellow/Warm White LED[J]. Acta Optica Sinica, 2020, 40(8): 0823001
- Acta Optica Sinica
- Vol. 40, Issue 8, 0823001 (2020)
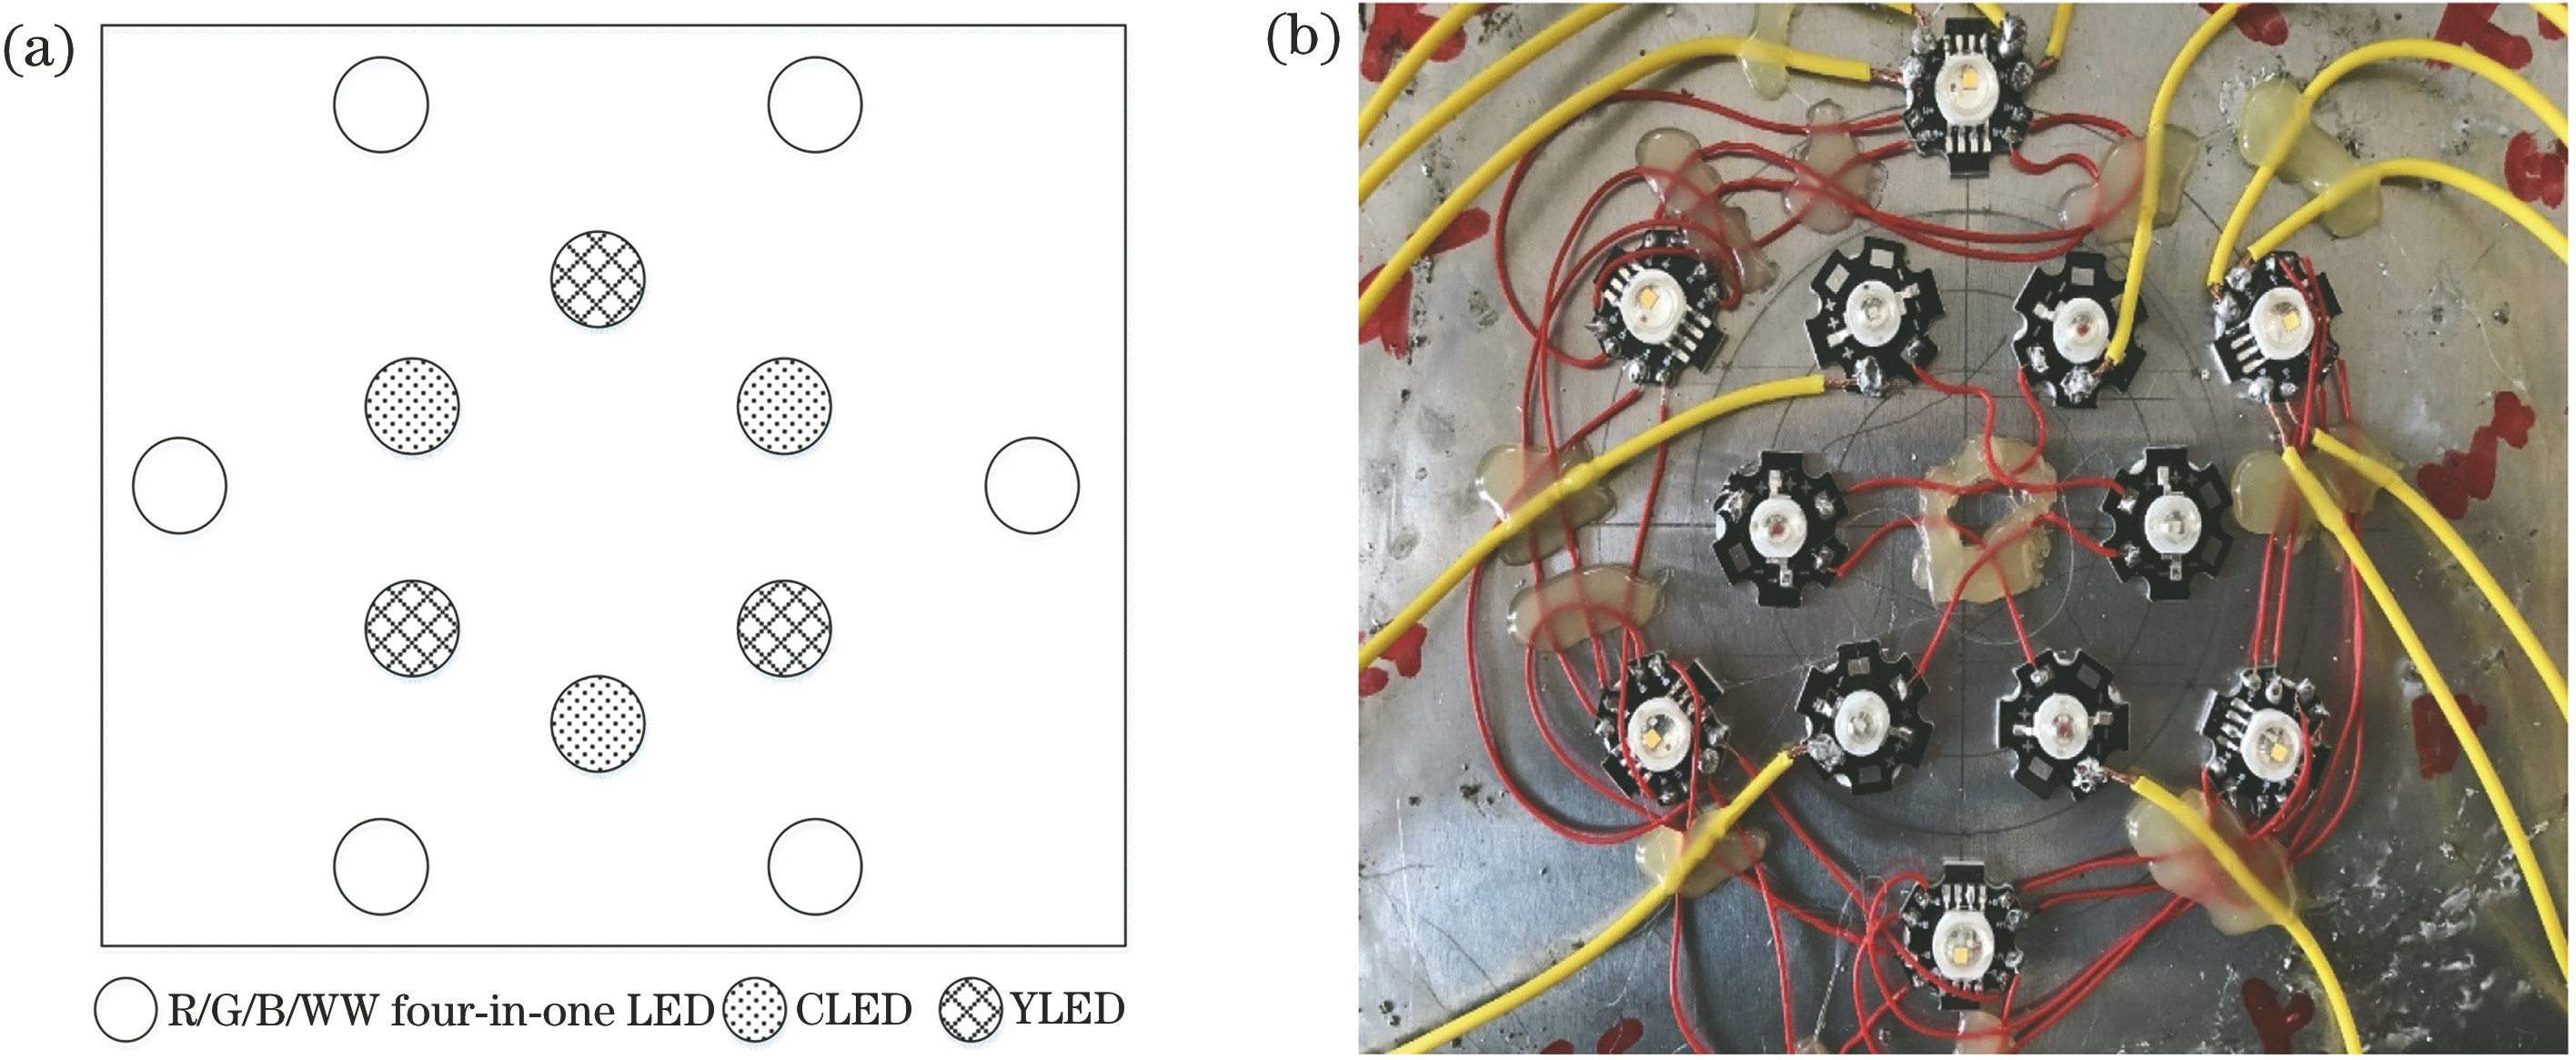
Fig. 1. Light source module used in the experiment. (a) R/G/B/C/Y/WW LED lamp bead layout; (b) R/G/B/C/Y/WW LED physical drawing of light source
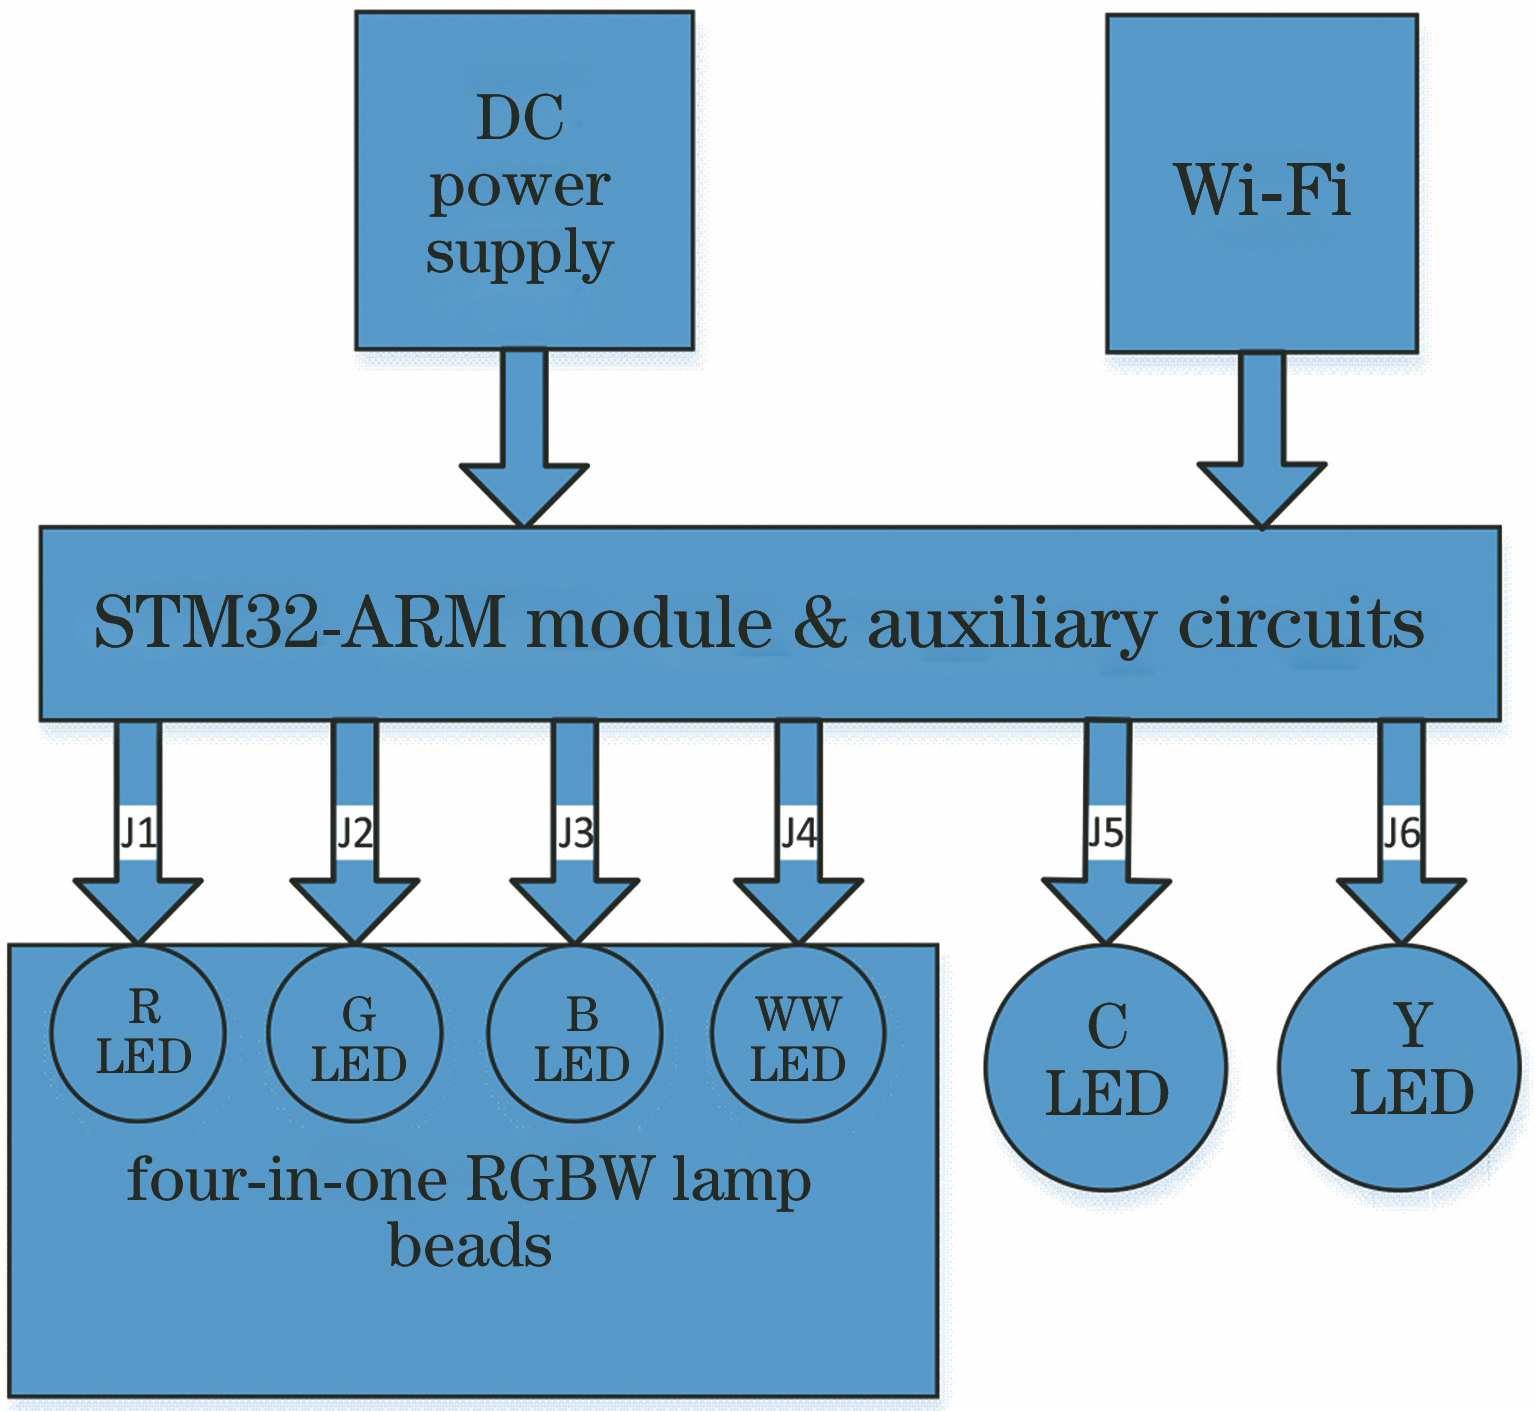
Fig. 2. R/G/B/C/Y/WW LED module drive circuit schematic
Fig. 3. Light source parameters of R/G/B/C/Y/WW LED. (a) Chromaticity coordinate of each LED; (b) relative spectral power distribution of the LED
Fig. 4. Relationship between duty cycle and luminous flux of R/G/B/C/Y/WW LED. (a) ΦR--DR; (b) ΦG--DG; (c) ΦB--DB; (d) ΦWW--DWW; (e) ΦC--DC; (f) ΦY--DY
Fig. 5. Relationship between Ra and r1 at Tc=2700 K and r2=[0.05, 1.00]. (a) r3=0.05; (b) r3=0.10; (c) r3=0.15
Fig. 6. Relationship between Ra and r1 at Tc=4000 K and r2=[0.05, 1.00]. (a) r3=0.15; (b) r3=0.20; (c) r3=0.25
Fig. 7. Relationship between Ra and r1 at Tc=5500 K and r2=[0.05, 1.00]. (a) r3=0.15; (b) r3=0.20; (c) r3=0.25
Fig. 8. Relationship between Ra and r1 at Tc=7000 K and r2=[0.05, 1.00]. (a) r3=0.10; (b) r3=0.15; (c) r3=0.20
Fig. 9. Lighting effect photos of R/G/B/ C/Y/WW LED module. (a) Tc=2700 K; (b) Tc=4000 K; (c) Tc=5500 K; (d) Tc=7000 K
|
Table 1. R/G/B/C/Y/WW lamp bead parameters in the experiment
|
Table 2. Comparison of the set and measured values at luminous flux Φ=500 lm

Set citation alerts for the article
Please enter your email address
© Copyright 2018-2021 | Chinese Laser Press. All Rights Reserved 沪ICP备15018463号-20