• Acta Optica Sinica
  • Vol. 39, Issue 6, 0628004 (2019)
Huimin Cao1、2、3、*, Faguang Li1、2、3, Lerong Dai1、2、3, Chao Wu1、2、3, Dongyun Zheng1、2、3, and Chunnan Zhu1、2、3
Author Affiliations
  • 1 College of Biomedical Engineering, South-Central University for Nationalities, Wuhan, Hubei 430074, China
  • 2 Key Laboratory of Brain Cognitive Science, State Ethnic Affairs Commission, South-Central University for Nationalities, Wuhan, Hubei 430074, China
  • 3 Hubei Key Laboratory of Medical Information Analysis & Tumor Diagnosis and Treatment, Wuhan, Hubei 430074, China;
  • show less
    DOI: 10.3788/AOS201939.0628004 Cite this Article Set citation alerts
    Huimin Cao, Faguang Li, Lerong Dai, Chao Wu, Dongyun Zheng, Chunnan Zhu. Novel Portable Sensor for Simultaneous Monitoring of Oxygen and Temperature[J]. Acta Optica Sinica, 2019, 39(6): 0628004 Copy Citation Text show less
    Schematics of sensors. (a) 2 μL AFC film; (b) 2 μL PtTFPP film; (c) 2 μL Rh110 film; (d) 2 μL mixed film; (e) without film
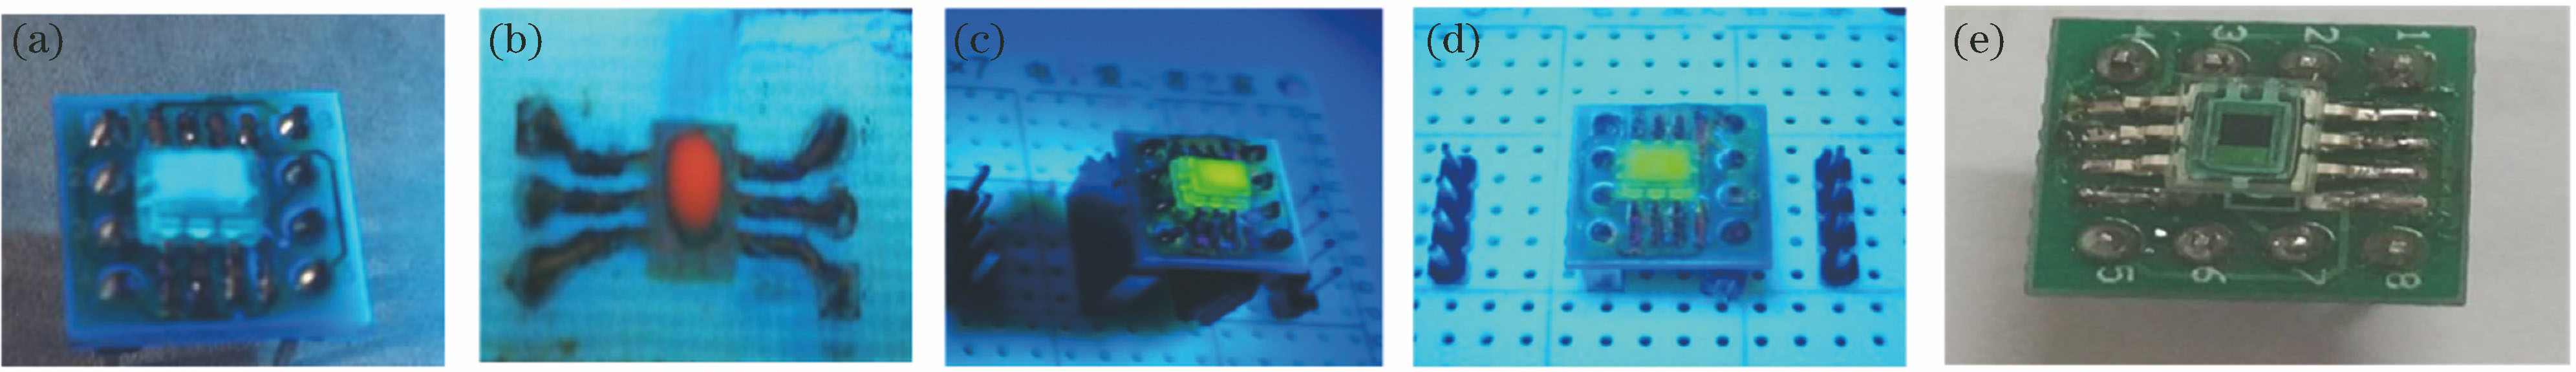
    Fig. 1. Schematics of sensors. (a) 2 μL AFC film; (b) 2 μL PtTFPP film; (c) 2 μL Rh110 film; (d) 2 μL mixed film; (e) without film
    Dual-sensor performance detection device
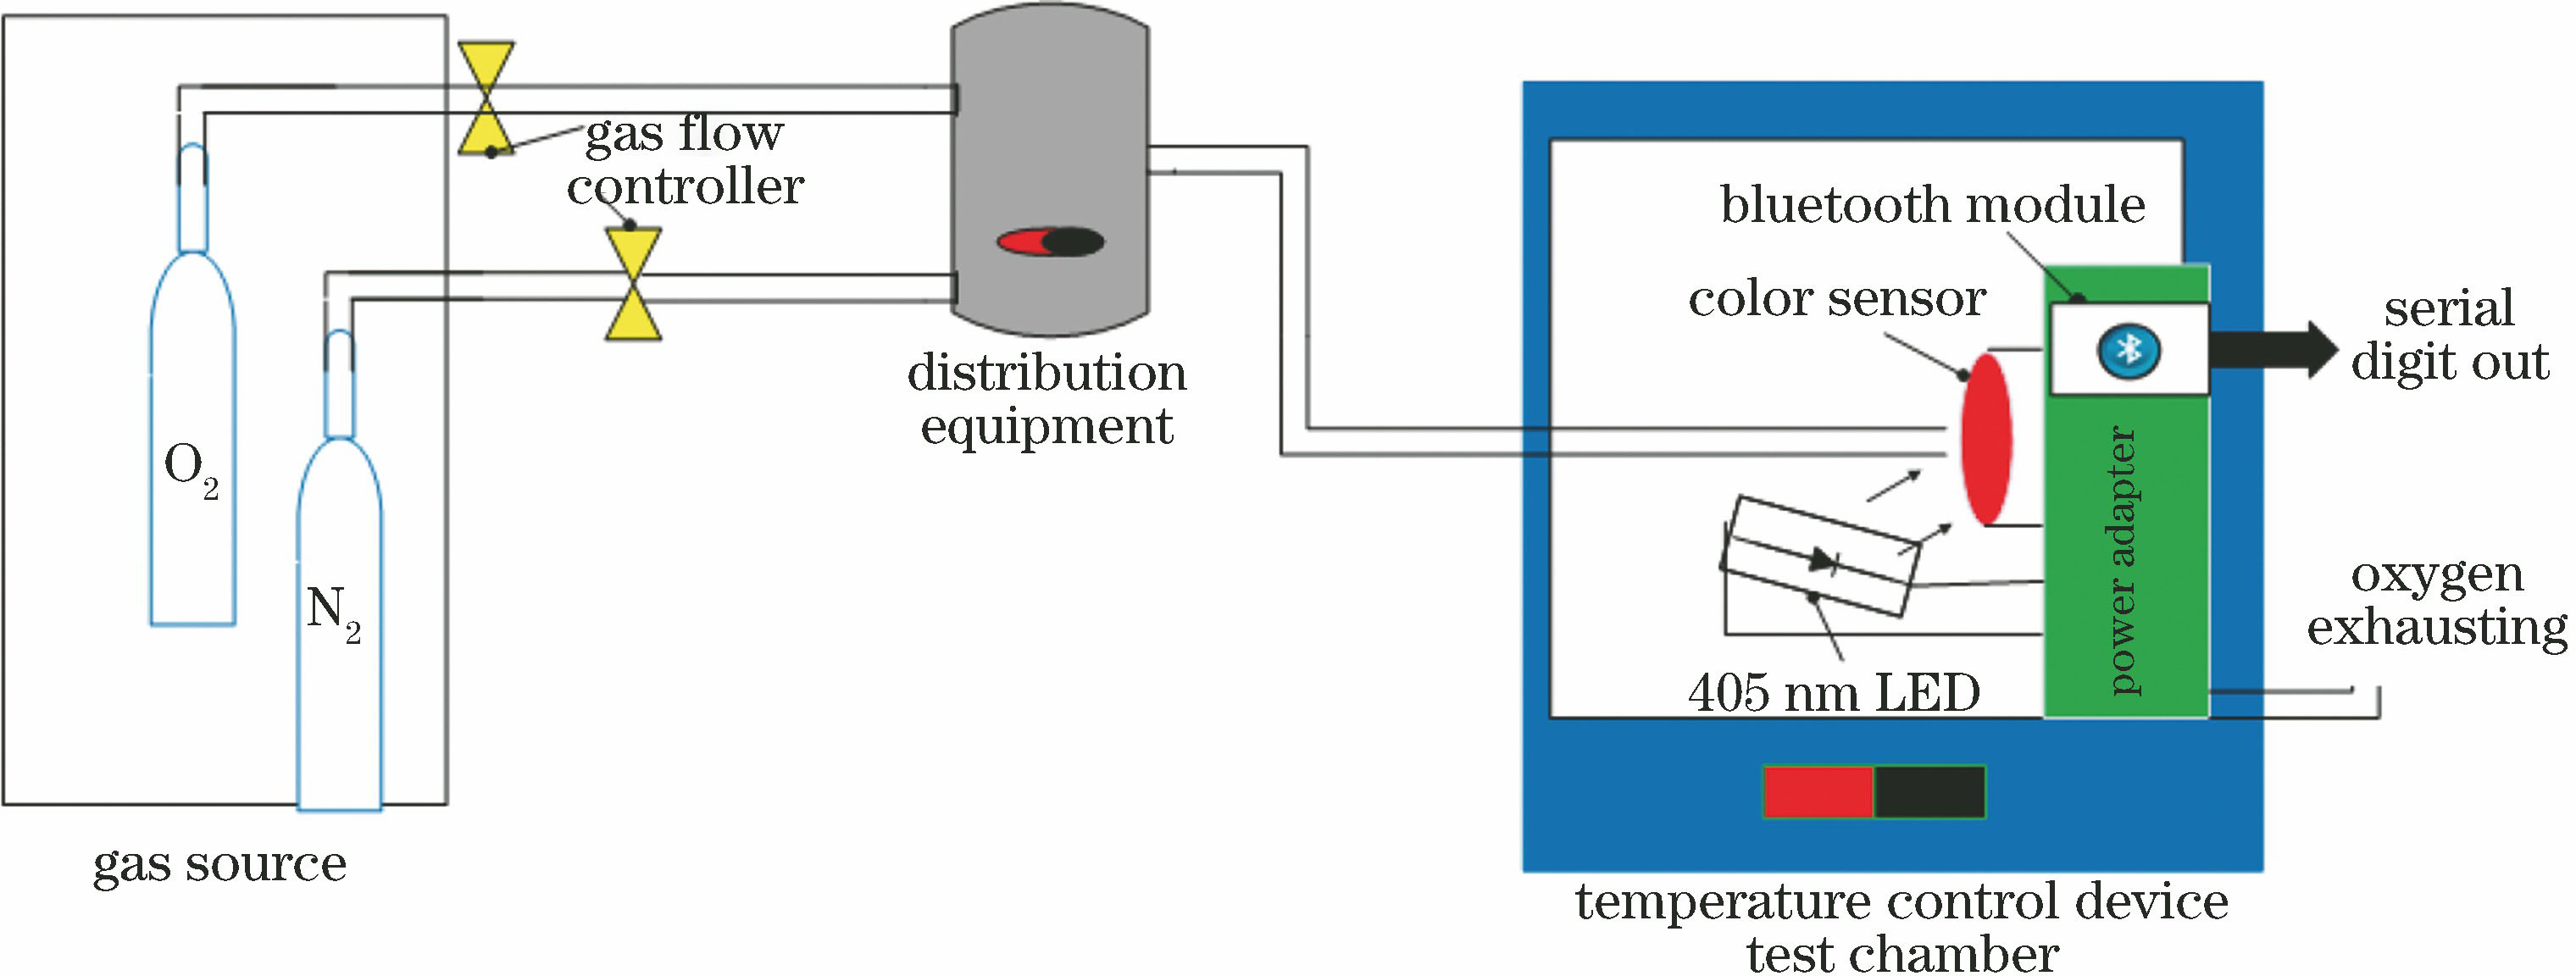
    Fig. 2. Dual-sensor performance detection device
    Block diagram of hardware function of sensing system
    Fig. 3. Block diagram of hardware function of sensing system
    Fluorescence spectra of PtTFPP, AFC, and Rh110 at room temperature
    Fig. 4. Fluorescence spectra of PtTFPP, AFC, and Rh110 at room temperature
    Fluorescence quenching response spectra of oxygen-sensitive material
    Fig. 5. Fluorescence quenching response spectra of oxygen-sensitive material
    Fluorescence quenching response spectra of temperature-sensitive material
    Fig. 6. Fluorescence quenching response spectra of temperature-sensitive material
    Relationship between fluorescence intensity ratio and oxygen concentration
    Fig. 7. Relationship between fluorescence intensity ratio and oxygen concentration
    Relationship between fluorescence intensity ratio and temperature
    Fig. 8. Relationship between fluorescence intensity ratio and temperature
    Relationship between fluorescence intensity and oxygen concentration under different temperatures
    Fig. 9. Relationship between fluorescence intensity and oxygen concentration under different temperatures
    ReagentSupplierPurity
    PtTFPPAlfa Aesar≥99.0%
    Rh110Alfa Aesar≥99.0%
    AFCSigma-Alorich≥99.0%
    TEOSSinopharm Chemical≥95.0%
    Octyl-tri EOSSinopharm Chemical≥95.0%
    TESPICSinopharm Chemical≥95.0%
    Triton-X-100Wuhan ShenshiChemical pure
    THFWuhan ShenshiAnalytical pure
    Table 1. Experimental reagents and related parameters
    InstrumentSpecification typeProducer
    Magnetic heating stirrer79-2Jintan China
    Digital ultrasonic cleanerKQ3200DBKunshan China
    CentrifugeD-37520Wuhan China
    Rotary evaporatorRE-52AAShanghai China
    Fluorescence spectrophotometerF-7000Hitachi High-Technologies
    Electron microscopesSU8010Hitachi High-Technologies
    Table 2. List of experimental instruments
    Standard value /%36912151821242730
    Measured value /%2.885.719.3211.5815.2318.3921.3624.4127.2230.15
    Bias /%-4.00-4.833.563.501.532.171.711.710.810.50
    Table 3. Measurement value and accuracy of oxygen concentration
    Standard value /℃515253545556575
    Measured value /℃4.1214.2624.8634.1746.8356.2463.8572.85
    Bias /%-17.60-4.93-0.56-2.374.072.25-1.77-2.87
    Table 4. Measurement value and accuracy of temperature
    Huimin Cao, Faguang Li, Lerong Dai, Chao Wu, Dongyun Zheng, Chunnan Zhu. Novel Portable Sensor for Simultaneous Monitoring of Oxygen and Temperature[J]. Acta Optica Sinica, 2019, 39(6): 0628004
    Download Citation