
Zhouying SONG, Qiaoling ZHU. Spatio-temporal pattern and driving forces of urbanization in China’s border areas[J]. Journal of Geographical Sciences, 2020, 30(5): 775
- Journal of Geographical Sciences
- Vol. 30, Issue 5, 775 (2020)
Abstract
1 Introduction
China’s border areas are geographically remote and have poor transport connectivity and resource endowments. Population distribution in such areas is sparse, and there is little economic development momentum, and urbanization occurs slowly. The lower levels of urbanization in border areas has, to a certain extent, impeded the process of building a moderately prosperous society in all respects and optimizing the spatial layouts of cities and towns in China. In 2018, of China’s 134 county-level administrative regions in border areas, 36 were key counties included in the national plan for poverty alleviation through development, which are areas that China focuses on to achieve coordinated regional development. On the other hand, border areas, especially border crossings, are important gateways to China’s interior (
Many scholars have studied urbanization patterns in China (
On the whole, research on China’s urbanization tends to concentrate on the national level or on the central and eastern regions, with fewer studies looking at border areas. China’s border areas are far from regional economic centers, and they are less urbanized than other parts of China. Moreover, due to their locations and environments, driving mechanisms of urbanization in border areas are necessarily different from other regions. In addition, given the importance of county and small- and medium-sized cities in the national economic development strategy, the urbanization of counties has increasingly become an important field of urbanization research (
2 Research framework
2.1 Unique features of urbanization in border areas
Urbanization is occurring relatively slowly in China’s border areas compared to the national rate of urbanization (
The natural environment differs widely in China’s border areas, with many unfavorable factors capable of restricting the development of urbanization. The Tianshan Mountains, the Himalayas and the Hengduan Mountains create barriers to external relations in border areas, which limit urban construction and spatial expansion. Moreover, many border counties in Inner Mongolia, Xinjiang and Tibet have cold and arid climates, and natural disasters occur frequently, increasing the cost of economic development and making them ill-suited to population concentrations.
Looking at population and society, border areas are home to high proportions of ethnic minorities. Most of these ethnic groups are distributed across borders, providing a social basis for interaction and cooperation with neighboring countries (
In terms of transportation, border areas require integration with both domestic and international markets. Domestically, border transportation routes are sparse. Border areas tend to be separated from domestic core markets and have a scattered economic spatial layout, both of which hinder the flow of factors of production (
Cross-border economic and trade cooperation is an important economic activity in border areas. Different factor endowments and development levels on either side of a border encourage regional economic cooperation. Adding their geographical and cultural proximity, border areas tend to develop into functional spaces for sharing and exchanging resources (
In terms of geopolitical environment, border areas are not only buffer zones for safeguarding national security but also strategically weak and sensitive areas (
Looking at policy conditions in border areas, China’s urban development is largely the result of capital accumulation and resource allocations guided by national and regional strategies, but the evolution of regional policies constantly changes the position of border area policies. The West China Development Strategy and the Belt and Road Initiative have created huge development opportunities for border areas.
In terms of industrial development, industries in border areas lag behind the rest of the country, while industrial structures tend to be relatively singular and industrial bases of urbanization tend to be relatively weak. The development of tourism resources in border counties, however, is highly valuable (
2.2 Urbanization drivers
With consideration given to the unique features of border areas, and combining relevant drivers identified in existing research, this paper categorizes the driving forces of urbanization into natural force, administrative force, market force, industrial force, transportation force and social force (
| Indicator | Units | Description | Data source | Weight | |||||
|---|---|---|---|---|---|---|---|---|---|
| Natural force | Average annual precipitation | mm | Measures the livability of climatic conditions via the average annual precipitation of county-level units | China Meteorological Data Service Center (CMDC) | 0.25 | ||||
| Average annual temperature | ℃ | Measures the livability of climatic conditions via the average annual temperature of county-level units | China Meteorological Data Service Center (CMDC) | 0.25 | |||||
| Average altitude | km | Measures the topographic conditions in border areas via average elevation of county-level units | Geospatial Data Cloud | 0.25 | |||||
| Arable land area | ha | Measures the scale of arable land in border areas | China Economic and Social Development Statistics Database | 0.25 | |||||
| Administrative force | Local fiscal expenditure | 10,000 RMB | Measures the administrative and regulatory capacity of local governments | China Statistical Yearbook (County-Level) | 0.3 | ||||
| Public and private fixed-asset investment | 10,000 RMB | Measures the economic capacity of local governments | China Statistical Yearbook (County-Level) | 0.3 | |||||
| Preferential policy index | / | Measures national policy support (at a scale of 0-5 based on the following five policy conditions) 1 = West China Development and Northeast Revitalization programs2 = Pilot for supporting reforms along borders and pilot for supporting reform of modern agriculture3 = Border economic cooperation zone, comprehensive free trade zone or “prosperity to border areas and their residents” pilots4 = Key experimental zones for development and opening up 5 = Cross-border economic cooperation zones | Websites of Ministry of Commerce and National Development and Reform Commission | 0.4 | |||||
| Market force | Total retail sales of consumer goods | 10,000 RMB | Measures the size of domestic markets in border areas | China Statistical Yearbook (County-level) | 0.4 | ||||
| Bilateral trade | 10,000 USD | Measures the level of trade development in border areas | International Trade Centre databases | 0.2 | |||||
| Bilateral economic integration | / | Measures the bilateral trade environment (with integration scores of 0-3)0 = The two countries have no trade agreement1 = Both countries have joined economic organizations or agreements, such as WTO, CAFTA, BRI, etc. 2 = Countries are in bilateral trade negotiations3 = Countries have signed a bilateral free trade agreement | Websites of Ministry of Commerce and National Development and Reform Commission | 0.2 | |||||
| Market opportunities | / | Measures market size, market expectations, etc., of neighboring countries in border areas (expressed as per capita GDP of neighboring country/per capita GDP of border area) | China Statistical Yearbook (County-level) & World Bank databases | 0.2 | |||||
| Industrial force | Industrial output | 10,000 RMB | Measures the level of industrialization | China Statistical Yearbook (County-level) | 0.4 | ||||
| Tourism revenue | Million USD | Measures the level of development of tourism | China Statistical Yearbook | 0.3 | |||||
| GRP | 100 million RMB | Measures overall industrial development | China Statistical Yearbook (County-level) | 0.3 | |||||
| Transportation force | Transport route density | km/km2 | Measures level of transportation access to China’s hinterland (the ratio of the length of transport routes to the administrative area, including road and rail routes) | China Statistical Yearbook | 0.4 | ||||
| Transport status | / | Determines whether a county is an important transportation node in China’s opening up drive | Websites of Ministry of Commerce and National Development and Reform Commission | 0.3 | |||||
| Air transport development | / | Measures the level of aviation development (0-3 assigned based on airport construction)0 = No airport of category 3C or higher1 = has a 3C airport2 = has a 4C airport3 = has a 4D airport | General Aviation Resource Net of China | 0.3 | |||||
| Social force | Proportion of population made up of ethnic minorities | / | Measures social and cultural integration with neighboring countries | Census | 0.4 | ||||
| Education level | People | Number of primary and secondary school students and ordinary middle school students per 10,000 people | China Statistical Yearbook (County-level) | 0.3 | |||||
| Medical care level | Beds | Number of beds in medical institutions per 10,000 people | China Statistical Yearbook (County-level) | 0.3 | |||||
Table 1.
Drivers of urban development in China’s border areas and their weights
Natural force reflects basic natural conditions that are conducive to urbanization, including local livability and resources (
Administrative force reflects the preferential rights provided to regions by national or local policies to support better allocations of funds, land or other factors of production to achieve economic construction and urban development (
Market force measures the size and potential of domestic and foreign markets. Given that the development of cities and towns in China’s southwest border areas is driven by border trade (
For industrial force, the three indicators of gross regional product (GRP), industrial output and tourism income are chosen to represent overall economic scale, industrial development and industries with prospects and advantages in border areas (
Transportation force measures the degree to which border areas act as cross-border transport corridors to both China’s hinterland and external markets, including both land- and air-based transportation (
Social force reflects regional social welfare levels and includes the indicators of medical care and education in this study. In addition, because border areas tend to be home to concentrations of ethnic minorities in China, the proportion of the population of an area that is made up of ethnic minorities is also used as an indicator.
Regarding the weights of the various indicators, first, this article referred to existing literature and field research data to preliminarily assign weights to each indicator. Weights were then revised based on field surveys and interviews with government officials, company leaders and individual businesses in border areas. In addition, opinions of relevant personnel at the National Development and Reform Commission’s West China Development Department and experts in border areas were sought to finalize the weight of each indicator (see
3 Research methods and data
3.1 Research methods
(1) Coefficient of Variation
This paper uses the coefficient of variation (CV) to measure spatial differences in levels of urbanization in border counties, that is, the standard deviation of urbanization levels in 134 border counties divided by the mean.
(2) Geo-detectors
In this paper, geo-detectors are used to explore driving factors of urbanization in border areas and interactions between drivers. Geo-detectors are a group of statistical tools that detect spatial differentiation and reveal the driving forces behind them (
Factor detector is mainly used to measure the explanatory power of different driving forces regarding urbanization. The equation for calculating it is as follows:
wherein,
Interaction detector is used to identify the interactions between multiple main driving factors; that is, whether driving factors X1 and X2 increase or decrease the explanatory power of dependent variable Y, or whether their effects on Y are independent.
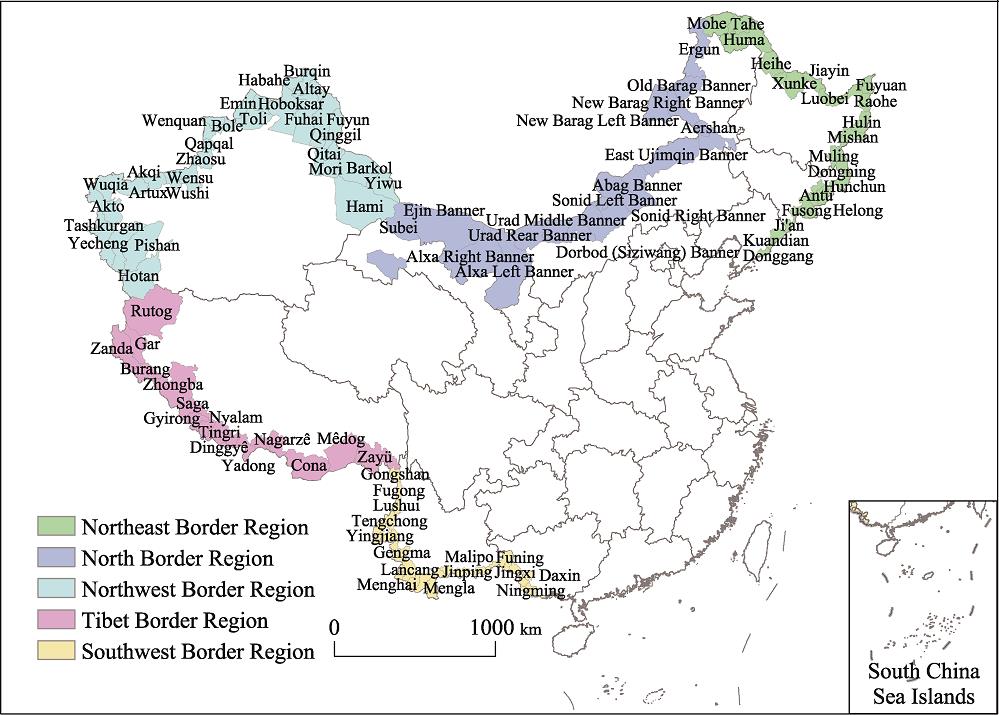
3.2 Study area
As can be seen in
![]()
Figure 1.Study area (China’s border areas)
3.3 Data sources
The urbanization level of a border area is measured as the percentage of the resident population living in urban areas based on data from the fifth and sixth national censuses of China and supplemented with data from the
4 Development of urbanization in border areas
4.1 Development trends
From 2000 to 2015, the urbanization level of China as a whole constantly increased, but urbanization in border areas was constrained by factors such as remoteness and underdeveloped transportation. This meant that the rate of urbanization in such areas grew rather slowly, the level of urbanization in such areas was lower than the national average and the gap between those areas and the national average continued to widen. As shown in
![]()
Figure 2.Changes in average urbanization level by region, 2000-2015
4.2 Spatio-temporal features
Between 2000 and 2015, the coefficient of variation (CV) index of urbanization in border areas dropped from 0.713 to 0.520, indicating the obviously reduced spatial disparity. However, the spatial pattern of urbanization in border areas did not change notably. The urbanization level was higher in the Northeast and North Border Regions and lower in the Northwest, Tibet and Southwest Border Regions. In accordance with the classification of natural breaks, the urbanization levels of border-area counties are divided into five classes (using 25%, 40%, 55% and 70% as the dividing points): very low, low, medium, high, and very high (see
![]()
Figure 3.Spatial characteristics of urbanization in China’s border areas, 2000-2015
In the year 2000, the urbanization levels of all counties in the Northwest, Tibet and Southwest Border Regions (with the exception of Fangchenggang, Dongxing, Pingxiang, Mangshi, Longchuan, and Ruili in the Southwest Border Region; Gar in the Tibet Border Region; and Altay and Hami in the Northwest Border Region) were below 40%, which meant they were in the low or very low classes. Of those border-area counties, the urbanization levels of Zhongba, Saga, Tingri and Gamba in Tibet were below 5%, the lowest in the country. In the Northeast and North Border Regions, other than the counties of Xunke, Jidong, Suibin, Fuyuan, Kuandian and Donggang on the northeastern border, and Horqin Right Front Banner, Dorbod (Siziwang) Banner, Damao United Banner and Urad Middle Banner on the northern border, the urbanization levels of all other counties were higher than 40%, which meant they were in the medium, high or very high classes. Among them, Erenhot, Manzhouli, Aershan, Mohe and Tahe had the highest levels of urbanization, all exceeding 90%.
In 2015, urbanization levels in the counties of Bole, Tacheng, Fuhai and Qitai in the northern part of the Northwest Border Region, the Subei Mongol Autonomous County, Alxa Left Banner and Dorbod (Siziwang) Banner in the central part of the North Border Region, and Huma, Tongjiang, Fuyuan, Dongning, Hunchun and Fuyuan in the eastern part of the Northeast Border Region increased significantly. Urbanization rate in counties in the northern part of the Northwest Border Region rose above the medium level, but urbanization levels in Hotan, Pishan, Wushi, Yecheng and Akto were still below 20%. The urbanization levels of counties in the Southwest Border Region increased slightly, but those of counties in the Tibet Border Region remained low. The urbanization levels of most counties in the Northeast Border Region and North Border Region were higher than 55%, putting them in the high or very high classes. The urbanization levels of both the Horqin Right Front Banner and Muling were below 40%.
4.3 Development model
Between 2000 and 2015, the growth rate of urbanization in border areas slowed overall. During that time, the urbanization levels of most counties increased less than 10%, and the levels of some counties even fell. In accordance with the classification of natural breaks, urbanization level growth was divided into four classes (negative growth, low growth, medium growth and high growth, with dividing points at 0%, 10% and 20%). As can be seen from
![]()
Figure 4.Urbanization growth rate in China’s border areas, 2000-2015
Based on the level of urbanization in 2000, border counties can be divided into below-medium level (L) and above-medium level (H), and based on the growth rate of urbanization rate between 2000 and 2015, counties can be divided into negative growth (N), medium-to-low growth (S) and high-speed growth (F). Combining the above two indicators, the urbanization development mode of China’s border areas consists of six types. As shown in
![]()
Figure 5.Spatial characteristics of development types for China’s border areas’ urbanization
5 Analysis of urbanization drivers in China’s border areas
5.1 Analysis of overall driving forces
The factor detector (
| Natural | Admin. | Market | Indust. | Transp. | Social | |
|---|---|---|---|---|---|---|
| All border areas | 0.103*** | 0.096*** | 0.058*** | 0.204*** | 0.224*** | 0.166*** |
| (0.000) | (0.000) | (0.000) | (0.000) | (0.000) | (0.000) | |
| Northeast | 0.248*** | 0.073*** | 0.018* | 0.014 | 0.133*** | 0.069*** |
| (0.000) | (0.000) | (0.068) | (0.135) | (0.000) | (0.000) | |
| North | 0.092*** | 0.132*** | 0.199*** | 0.039** | 0.190*** | 0.151*** |
| (0.000) | (0.000) | (0.000) | (0.017) | (0.000) | (0.000) | |
| Northwest | 0.063*** | 0.099*** | 0.048*** | 0.232*** | 0.228*** | 0.016* |
| (0.000) | (0.000) | (0.000) | (0.000) | (0.000) | (0.084) | |
| Tibet | 0.114*** | 0.036** | 0.052*** | 0.017 | 0.040 | 0.072*** |
| (0.000) | (0.042) | (0.007) | (0.324) | (0.256) | (0.000) | |
| Southwest | 0.037*** | 0.173*** | 0.198*** | 0.064*** | 0.138*** | 0.108*** |
| (0.000) | (0.000) | (0.000) | (0.000) | (0.000) | (0.000) |
Table 2.
Factor detection results of urbanization drivers in China’s border areas
Transportation is the main driver of urbanization in border areas. Due to the remote location and underdeveloped transport infrastructure of border areas, small improvements in transportation can lead to relatively significant economic and social benefits. For example, by improving their transportation infrastructure, border counties such as Bole and Pingxiang have attracted people and logistics and become business and trade hubs, thereby greatly promoting urban development.
Similar to urbanization in other regions, industrial force is one of the major factors in the development of urbanization in border areas (
Social and natural forces shape the livable environment through social services and the natural environment, which attract populations to cities, but they have a relatively small effect on urbanization in border areas. Local and national policy support can provide certain development advantages to border areas, but due to a lack of preferential policies for border areas in China in recent years, administrative force has had a limited effect on urbanization in border areas across a relatively large area.
Market force also has a limited effect on urbanization in border areas, which is related to the limited size of industries in those areas, backward transportation infrastructure, insufficient supplies of tradable goods and insufficient hinterland support. These result in the market potential of border areas not being realized.
The interaction detection results (
![]()
Figure 6.Interaction detection results of urbanization drivers in China’s border areas
5.2 Analysis of driving forces by region
In the urbanization of counties in the Northeast Border Region, transportation, administrative, social and natural forces all play significant roles, market force plays a lesser significant role, and industrial force has the least significant influence. The largest contribution is from natural force, due to relatively abundant precipitation, vast plains and abundant arable land, which provide favorable conditions for the development of towns along the northeast border. The second largest contribution is from transportation force, mainly because the ports of Suifenhe, Heihe, Hunchun, Helong and Dandong in China’s northeast provide international connections, facilitating domestic and foreign commodity trade and stimulating urban development through spillover effects. Market force, meanwhile, play less of a role in urbanization in the northeast because neighboring North Korea is largely closed off, Russia has a sparse population and border markets in neighboring countries offer limited trade. In addition, with the gradual weakening of traditional machinery and equipment manufacturing industries in the northeast and lack of competitiveness of emerging industries, industrial force has not provided effective impetus to urbanization.
In the urbanization of the North Border Region, transportation, market, administrative, social and natural force have played significant roles; whereas, industrial force has played a less significant role. Market and transportation drivers are the largest contributors because border economic cooperation zones and border ports, such as Erlianhot and Manzhouli, are important in connecting China with the rest of Eurasia (such as via the China-Mongolia- Russia Economic Corridor). Both these drivers have been effective in promoting the development of local urban areas.
In the urbanization of the Northwest Border Region, industrial, transportation, natural, administrative and market forces have played significant roles; whereas, social force has played a less significant role. Industrial and transportation forces are the largest contributors, mainly due to the Northwest Border Region being a transportation hub for many international economic corridors along the Silk Road Economic Belt. For example, important ports for overseas trade such as Khorgas, Bole (Alashankou) and Tacheng have upgraded the transportation status of their host counties, and strengthened their connectivity to domestic and international transportation networks, which have effectively promoted urbanization. In addition, the Northwest Border Region is home to several 5A-certified scenic spots, such as Koktokay (Fuyun) and Kanas (Habahe), the customs and culture of ethnic minorities in the region have proved popular with tourists, providing opportunities for cross-border tourism, which have greatly promoted urbanization.
In the urbanization of the Tibet Border Region, natural, social and market forces have played significant roles, while transportation and administrative forces have played a relatively significant role, but the influence of industrial and natural forces have not been significant. Compared to other border regions, however, with the exception of natural force, the effect of these driving forces has been relatively small. Counties in the Tibet Border Region are separated from neighboring countries by the Himalayas. They have poor natural conditions, small populations, inadequate transportation, and lagging socio-economic development. Generally, the various driving forces are weak. Most border counties in Tibet have been unable to cultivate drivers that can effectively promote urbanization, which is why both the level and speed of urbanization in the region remain low.
In the Southwest Border Region, the six major driving forces of urbanization have all played significant roles. Market and administrative forces contribute the most, followed by social and transportation forces, but industrial and natural forces contribute relatively little. Because the region includes Ruili, Mengla, Dongxing, Pingxiang and other border economic cooperation zones, as well as key development and opening-up experimental zones, cross-border economic cooperation zones and free-trade areas, national policies and local financial investment have supported urban development in the region. The Southwest Border Region is close to Southeast Asia’s vast international market and has opened up well, and development of the China-Indochina Peninsula Economic Corridor has improved domestic and international transportation connectivity at the southwest border, promoted the flow of goods and funds, and expanded port cities and their areas of influence in the hinterland. In addition, cross-border cultural, economic and trade exchanges are facilitated by the relatively flat topography of the Southwest Border Region, connections with neighboring counties via rivers such as the Nujiang River and Lancang River, the high population density of Southeast Asian countries and concentrations of ethnic groups that span borders. These market, administrative, social and economic factors have played an important role in promoting urbanization in the Southwest Border Region and in making it the fastest urbanizing region.
Taken together, transportation force plays an important role in the urbanization process, except in the Tibet Border Region; administrative, social and market forces play a relatively important role in urbanization in the North and Southwest Border Regions; natural force plays an important role in the urbanization of the Northeast and Tibet Border Regions; and industrial force plays a relatively important role in the urbanization of the Northwest Border Region only.
It can be seen, then, that transportation force is an important driver of urbanization in border areas generally, as border counties can achieve domestic and international connectivity to transport networks by opening ports and constructing important hubs along land routes, which can produce spillover effects, such as circulating and clustering factors of production, thereby promoting urban development. Administrative force plays a limited role in promoting urbanization in border areas, but that role is more notable in border areas with higher local fiscal expenditure. The role of social and market forces in the urbanization of border areas depends on the socio-economic conditions of neighboring countries. Border areas with close social, cultural and economic connections with neighboring countries have stronger social and market forces. As the foundation of urban development, different natural conditions have different effects on urbanization, such as in the most urbanized Northeast Border Region and the least urbanized Tibet Border Region. Due to the relatively backward industrial development of most border areas, however, natural and industrial forces have small impetus on urbanization.
The results of the interaction detection analysis (
First, the explanatory power of interactions between driving forces on the level of urbanization in the Northeast Border Region is non-linear enhanced. Explanatory power was enhanced significantly after interactions between natural and market forces, between natural and administrative forces, between industrial and transportation forces, between administrative and market forces and between administrative and industrial forces. Good natural conditions are conducive to exploiting market and administrative drivers. As the Northeast Border Region has a good foundation of industrial development, transportation construction and industrial development are compatible, which can effectively promote urban development. In addition, the policies and fiscal expenditure of the Northeast Border Region are conducive to market expansion and industrial development, which can effectively promote the process of urbanization.
Second, the explanatory power of interactions between driving forces on the urbanization level in the North Border Region largely has a non-linear enhancement effect. Explanatory power is enhanced significantly after interactions between industrial force and transportation force, because the North Border Region has an established foundation of industry, and local raw material processing and corresponding products can circulate with the support of transportation, thereby promoting urban development together.
![]()
Figure 7.Interaction detection results of urbanization drivers in China’s border areas
Third, explanatory power is enhanced significantly after interactions between market and transportation forces in the Northwest Border Region, followed by interactions between administrative and market forces. Because Khorgas and Alashankou on China’s northwest border are important nodes in the New Eurasian Land Bridge and China-Central Asia-West Asia International Economic Corridor, they have direct connections to Central Asian and European markets. Large markets and convenient transportation conditions are mutually reinforcing, so they jointly increase local urbanization levels. In addition, policies on border economic cooperation zones, free-trade areas and cross-border economic cooperation zones are conducive to expanding markets, increasing regional market drivers and promoting urbanization.
Fourth, explanatory power is enhanced markedly after interactions between driving factors in the Tibet Border Region. Specifically, explanatory power increases greatly after interactions between natural and market forces and to a slightly lesser extent after interactions between administrative and market forces, indicating that the harsh natural environment and resource conditions of the Tibet Border Region have a strong negative impact on market expansion. Although the direct driving effect of administrative force on urbanization is low, it indirectly promotes urbanization by expanding market potential.
Fifth, the enhancement effect of interactions between driving forces is lower in the Southwest Border Region than in other regions, but explanatory power is enhanced significantly by interactions between natural and social forces, between natural and industrial forces, and between natural and administrative forces. Although natural force has weak explanatory power on the urbanization of the Southwest Border Region, it is the basic influencing factor on the distribution and flow of the border population and the effect of policy implementation. Its explanatory power gets stronger when interacting with social and administrative forces.
There is an evident mutually reinforcing effect between urbanization drivers in border areas, mainly non-linear in character but bilinear in some cases. The interactions of natural force are the strongest. With the exception of the Northwest Border Region, interactions between natural force and other driving forces have a nonlinear enhancement effect with stronger interactions. This indicates that the natural environment is still a basic factor in urbanization.
6 Conclusions and discussion
6.1 Conclusions
China’s border areas are important gateways between the hinterland and the outside world. They are key areas for building a moderately prosperous society in all respects in China and an important part of optimizing the urban spatial pattern. The unique locations of border areas make the process and driving forces of urbanization quite different from other parts of the country. Further research is urgently needed in this area. Based on an analysis of a large volume of data, this study conducted an in-depth analysis of the pattern and driving mechanisms of urbanization in China’s border areas between 2000 and 2015. The study found the following:
First, in the study period, the level of urbanization in border areas was lower than the national average, and there was a widening gap. Border areas are suffering from lagging urban development and insufficient dynamism, and some areas are even experiencing population loss.
Second, during the same period, spatial differences in the urbanization of border areas narrowed significantly, with the coefficient of variation (CV) value falling from 0.713 to 0.520. Looking at specific regions, the level of urbanization is low in the Northwest Border Region and Southwest Border Region, but urbanization is occurring relatively quickly; the urbanization level in the Tibet Border Region is the lowest, and its urbanization growth is flat; the levels of urbanization in the Northeast Border Region and North Border Region are slightly higher, but the rate of urbanization is slow or even stagnant.
Third, transportation force and industrial force are the largest contributors to urbanization in border areas, and market force has the smallest effect. There is clear mutual reinforcement between the various driving forces.
Fourth, the main drivers of urbanization in the Northwest Border Region and the Southwest Border Region are industrial and transportation forces, market and administrative forces respectively. They have formed the driving mechanisms which can effectively boost the stage of urbanization in these areas. Natural, social and economic conditions in the Tibet Border Region are weak, so they have not become drivers that contribute strongly to urbanization. Transportation force in the Northeast Border Region and North Border Region has made a significant contribution to urbanization, and its interactions with market and industrial forces have a clear enhancement effect.
6.2 Discussion
Studies have found that China’s eastern region has successfully seized the opportunities presented by globalization to achieve rapid industrialization and urbanization. The main drivers of urbanization in the region are its economic level, industrial structure, foreign investment, fixed-asset investment, population size, policy orientation, locational advantages and technological innovation (
For regions with relatively high levels of urbanization, such as the Northeast Border Region and the North Border Region, it is recommended that governments formulate more preferential tax and fee policies for local border trade; create more special function platforms, such as border town trade areas, border economic cooperation zones and key experimental zones for development and opening-up; actively cultivate a market environment in border areas; promote the interaction of multiple driving forces, such as transportation, market and administrative forces; and jointly promote the development of urbanization in these border areas. For areas with lower levels of urbanization but with better development, such as the Northwest Border Region and the Southwest Border Region, due to their better policy and market conditions, it is recommended that governments urge the construction of more cross-border transport corridors under the Belt and Road Initiative, strengthen links between border areas and domestic and international markets, and enhance interactions between transportation and existing industrial and market forces, so as to promote urbanization. Due to the Tibet Border Region’s lack of resources, poor natural environment and poor accessibility, it is recommended that governments further increase subsidies for border residents, strengthen construction of local transport infrastructure, increase social security, such as education and medical care, stem population loss in border areas, and use administrative force in combination with industrial and social forces - primarily tourism - to promote urbanization.
References
[1] Theorizing borders: An interdisciplinary perspective. Geopolitics, 10, 633-649(2005).
[3] Urbanization in China and the case of Fujian Province. Modern China, 32, 99-130(2016).
[5] The comprehensive evaluation of China’s urbanization and spatial difference in provincial level. Economic Geography, 34, 54-59(2014).
[8] et alTriple functions of country border and its concerning optimized combination under the perspective of geopolitical security. Human Geography, 27, 73-77(2012).
[14] Focus on frontier research in China under the perspective of tourism. Geographical Research, 34, 407-421(2015).
[17] Elementary introduction to the selection of the economic developmental patterns in the border areas. N.W. Ethno-National Studies, 37, 98-106(2003).
[18] Geopolitical and geo-economic situation around and China’s strategies. Progress in Geography, 33, 289-302(2013).
[20] The Geography of Border Landscapes. London:Routledge(1991).
[24] From frontier to bridgehead: Cross-border regions and the experience of Yunnan, China. International Journal of Urban and Regional Research, 37, 1213-1232(2013).
[25] China’s new-type urbanization and investment demand prediction analysis, 2015-2030. Acta Geographica Sinica, 71, 1025-1044(2016).
[26] The boundary effect and cross-border subregional economic cooperation: A case study of East Asia. Human Geography, 17, 8-12(2002).
[27] Geographic patterns of air passenger transport in China. Scientia Geographica Sinica, 23, 519-525(2003).
[28] et alAnalysis of new urbanization’s spatial pattern evolution and influence factors in China. Scientia Geographica Sinica, 36, 63-71(2016).
[29] An organizational model and border port hinterlands for the China-Europe Railway Express. Journal of Geographical Sciences, 28, 1275-1287(2018).
[31] The study on comprehensive evaluation and urbanization division at county level in China. Geographical Research, 31, 1305-1316(2012).
[34] Exo-urbanization: The case of the Zhujiang River Delta. Acta Geographica Sinica, 52, 193-206(1997).
[35] et alThe influencing factors of resources and environments in the process of urbanization of China. Progress in Geography, 27, 94-100(2008).
[36] Driving force, characteristics and strategic orientation of urbanization in resource-based areas: A case of study of Shanxi Province. City Planning Review, 34, 67-72(2010).
[37] et alEvaluation and utilization strategies of land border tourism resources in China. Resources Science, 36, 1117-1124(2014).
[38] et alThe new process of urbanization in the Pearl River Delta. Geographical Research, 38, 45-63(2019).
[39] Border space construction between Shenzhen and Hong Kong based on the “one country, two systems” policy: A case study of Chung Ying Street area. Geographical Research, 37, 2288-2304(2018).


Set citation alerts for the article
Please enter your email address

© Copyright 2018-2021 | Chinese Laser Press. All Rights Reserved 沪ICP备15018463号-20