• Spectroscopy and Spectral Analysis
  • Vol. 42, Issue 7, 2156 (2022)
Qiao-ling YANG1、*, Qin CHEN2、2;, Bing NIU2、2;, Xiao-jun DENG3、3; *;, Jin-ge MA3、3;, Shu-qing GU3、3;, Yong-ai YU4、4;, De-hua GUO3、3;, and Feng ZHANG5、5;
Author Affiliations
  • 11. School of Environmental and Chemical Engineering, Shanghai University, Shanghai 200444, China
  • 22. School of Life Sciences, Shanghai University, Shanghai 200444, China
  • 33. Technical Center for Animal Plant and Food Inspection and Quarantine, Shanghai Customs, Shanghai 200135, China
  • 44. Shanghai Oceanhood Opto-Electronics Tech. Co., Ltd., Shanghai 201201, China
  • 55. Chinese Academy of Inspection and Quarantine, Beijing 100176, China
  • show less
    DOI: 10.3964/j.issn.1000-0593(2022)07-2156-07 Cite this Article
    Qiao-ling YANG, Qin CHEN, Bing NIU, Xiao-jun DENG, Jin-ge MA, Shu-qing GU, Yong-ai YU, De-hua GUO, Feng ZHANG. Visualization of Thiourea in Bulk Milk Powder Based on Portable Raman Hyperspectral Imaging Technology On-Site Rapid Detection Method Research[J]. Spectroscopy and Spectral Analysis, 2022, 42(7): 2156 Copy Citation Text show less
    Schematic diagram of point scanning two-dimensional Raman spectroscopy imaging system
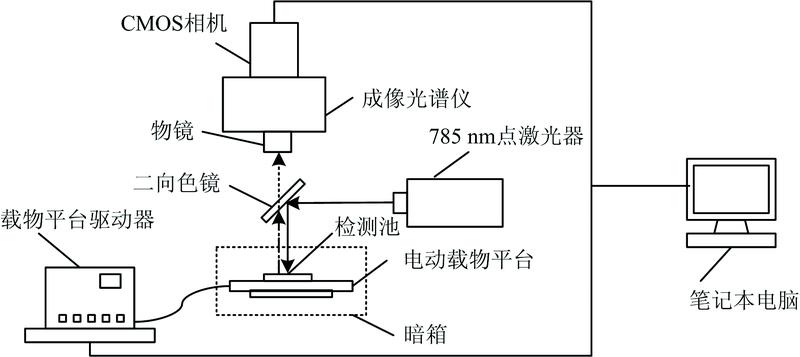
    Fig. 1. Schematic diagram of point scanning two-dimensional Raman spectroscopy imaging system
    Schematic diagram of sample preparation(a): Mold drawing required for double-layer sample;(b1): Double-layer sample drawing; (b2): Mixed sample drawing
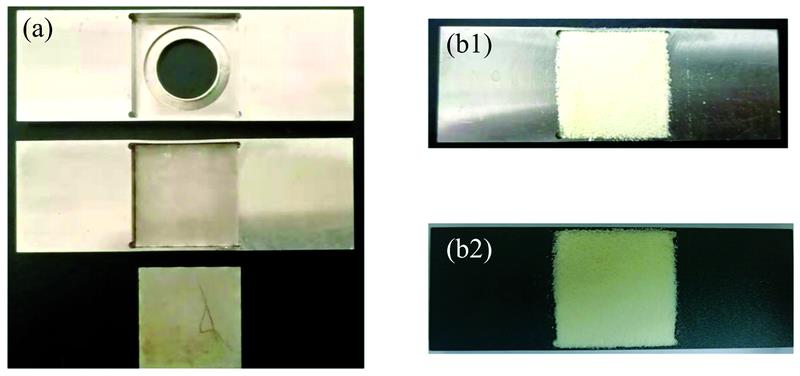
    Fig. 2. Schematic diagram of sample preparation
    (a): Mold drawing required for double-layer sample;(b1): Double-layer sample drawing; (b2): Mixed sample drawing
    Raman spectra of thiourea and milk powder under different integration time and laser power
    Fig. 3. Raman spectra of thiourea and milk powder under different integration time and laser power
    Raman spectra of double-layer samples with different milk powder thickness (n=3)
    Fig. 4. Raman spectra of double-layer samples with different milk powder thickness (n=3)
    Binary images of double-layer samples with different milk powder thickness (n=3)
    Fig. 5. Binary images of double-layer samples with different milk powder thickness (n=3)
    Binary heat map of mixed sample of thiourea milk powder (n=6)
    Fig. 6. Binary heat map of mixed sample of thiourea milk powder (n=6)
    Linear fitting graph of thiourea concentration and the number of pixels
    Fig. 7. Linear fitting graph of thiourea concentration and the number of pixels
    样本添加浓度
    (W/W, %)
    测量值平均值/
    (mg·kg-1)
    相对误差
    范围/%
    RSD/
    %
    品牌10.25检测点数7878770.25-2.66~4.013.46
    实测浓度0.240.260.240.260.240.24
    0.60检测点数2627292726280.58-6.63~1.713.36
    实测浓度0.560.580.610.580.560.59
    1.20检测点数6365636465631.19-1.89~0.891.38
    实测浓度1.181.211.181.191.211.18
    1.50检测点数8183808380821.49-2.61~0.721.55
    实测浓度1.481.511.461.511.461.49
    品牌20.25检测点数6768670.24-9.33~4.015.73
    实测浓度0.230.240.230.260.230.24
    0.60检测点数2526252726250.55-9.41~ -3.852.45
    实测浓度0.540.560.540.580.560.54
    1.20检测点数6263626163641.17-4.67~ -0.051.50
    实测浓度1.161.181.161.141.181.19
    1.50检测点数8079818280811.47-3.73~ -0.391.19
    实测浓度1.461.441.481.491.461.48
    品牌30.25检测点数6787680.24-9.33~4.016.13
    实测浓度0.230.240.260.240.230.26
    0.60检测点数2627282627250.57-9.41~ -1.073.08
    实测浓度0.560.580.590.550.580.54
    1.20检测点数6364626364651.19-3.28~0.891.48
    实测浓度1.181.191.161.181.191.21
    1.50检测点数8280818382801.48-2.61~0.721.36
    实测浓度1.491.461.481.511.491.46
    Table 1. Methodaccuracy verification form
    Qiao-ling YANG, Qin CHEN, Bing NIU, Xiao-jun DENG, Jin-ge MA, Shu-qing GU, Yong-ai YU, De-hua GUO, Feng ZHANG. Visualization of Thiourea in Bulk Milk Powder Based on Portable Raman Hyperspectral Imaging Technology On-Site Rapid Detection Method Research[J]. Spectroscopy and Spectral Analysis, 2022, 42(7): 2156
    Download Citation