
Kangnan Jiang, Ke Feng, Hao Wang, Xiaojun Yang, Peile Bai, Yi Xu, Yuxin Leng, Wentao Wang, Ruxin Li, "Measurement of electron beam transverse slice emittance using a focused beamline," High Power Laser Sci. Eng. 11, 03000e36 (2023)
- High Power Laser Science and Engineering
- Vol. 11, Issue 3, 03000e36 (2023)
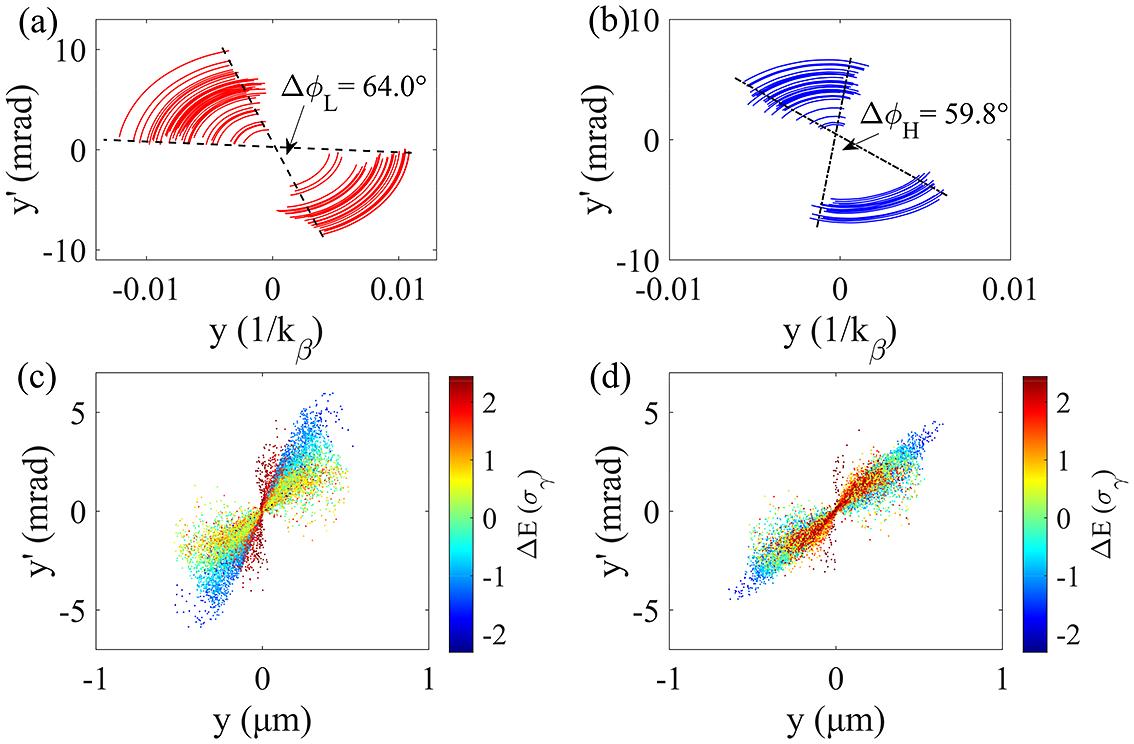
Fig. 1. The phase space trajectories of the low-energy part (a) and the high-energy part (b) in one electron beam; the electron beam transverse phase space distribution without (c) and with (d) phase compensation.
![(a) Schematic diagram of the experimental setup for single-shot measurement of electron emittance by using a focused beamline; (b) shock wave in the shadow graph; (c) statistics of the spot center position of the consecutive 62-shot electron beam on profile; (d) typical spectra of electron beams from the LWFA for 10 consecutive shots[24" target="_self" style="display: inline;">24].](/richHtml/hpl/2023/11/3/03000e36/img_2.png)
Fig. 2. (a) Schematic diagram of the experimental setup for single-shot measurement of electron emittance by using a focused beamline; (b) shock wave in the shadow graph; (c) statistics of the spot center position of the consecutive 62-shot electron beam on profile; (d) typical spectra of electron beams from the LWFA for 10 consecutive shots[24].
Fig. 3. (a) Single-shot image for the energy spectrum of a focused electron beam and (b) the corresponding energy-resolved sizes (blue line) and fitted curve (red line); (c) the phase difference of the energy offset relative to the center energy immediately after injection (red solid line) and acceleration (blue solid line) from FBPIC, and the calculated value of the final phase difference (pink dotted line).
Fig. 4. Electron beam slice emittance statistics at 1.5 bar (red) and 2 bar (blue) back pressures.
Fig. 5. (a) A typical electron beam spectrogram with initial pointing jitter, with two dashed-dotted lines perpendicular to the electron beam (red line) and at the same horizontal distance from the main optical axis (white line). (b) Corresponding relationship between the electron beam size and energy of the two slicing methods (the blue line corresponds to the white line in Figure 5(a) ) and (c) the relative intensity distribution of electrons in the slice where the dotted line is located (the dashed line is the fitted Gaussian curve). (d) The relationship between the initial electron beam pointing jitter and the slope of the electron distribution on the Lanex phosphor screen (red line) and the change in the emittance (blue line).


Set citation alerts for the article
Please enter your email address

© Copyright 2018-2021 | Chinese Laser Press. All Rights Reserved 沪ICP备15018463号-20