
Hang Wang, Meiping Wu, Peipei Lu, Xiu Ye. Effect of Laser Power on the Mechanical Properties of the Cobalt-Based/GO Composite Coatings[J]. Laser & Optoelectronics Progress, 2020, 57(9): 091405
- Laser & Optoelectronics Progress
- Vol. 57, Issue 9, 091405 (2020)
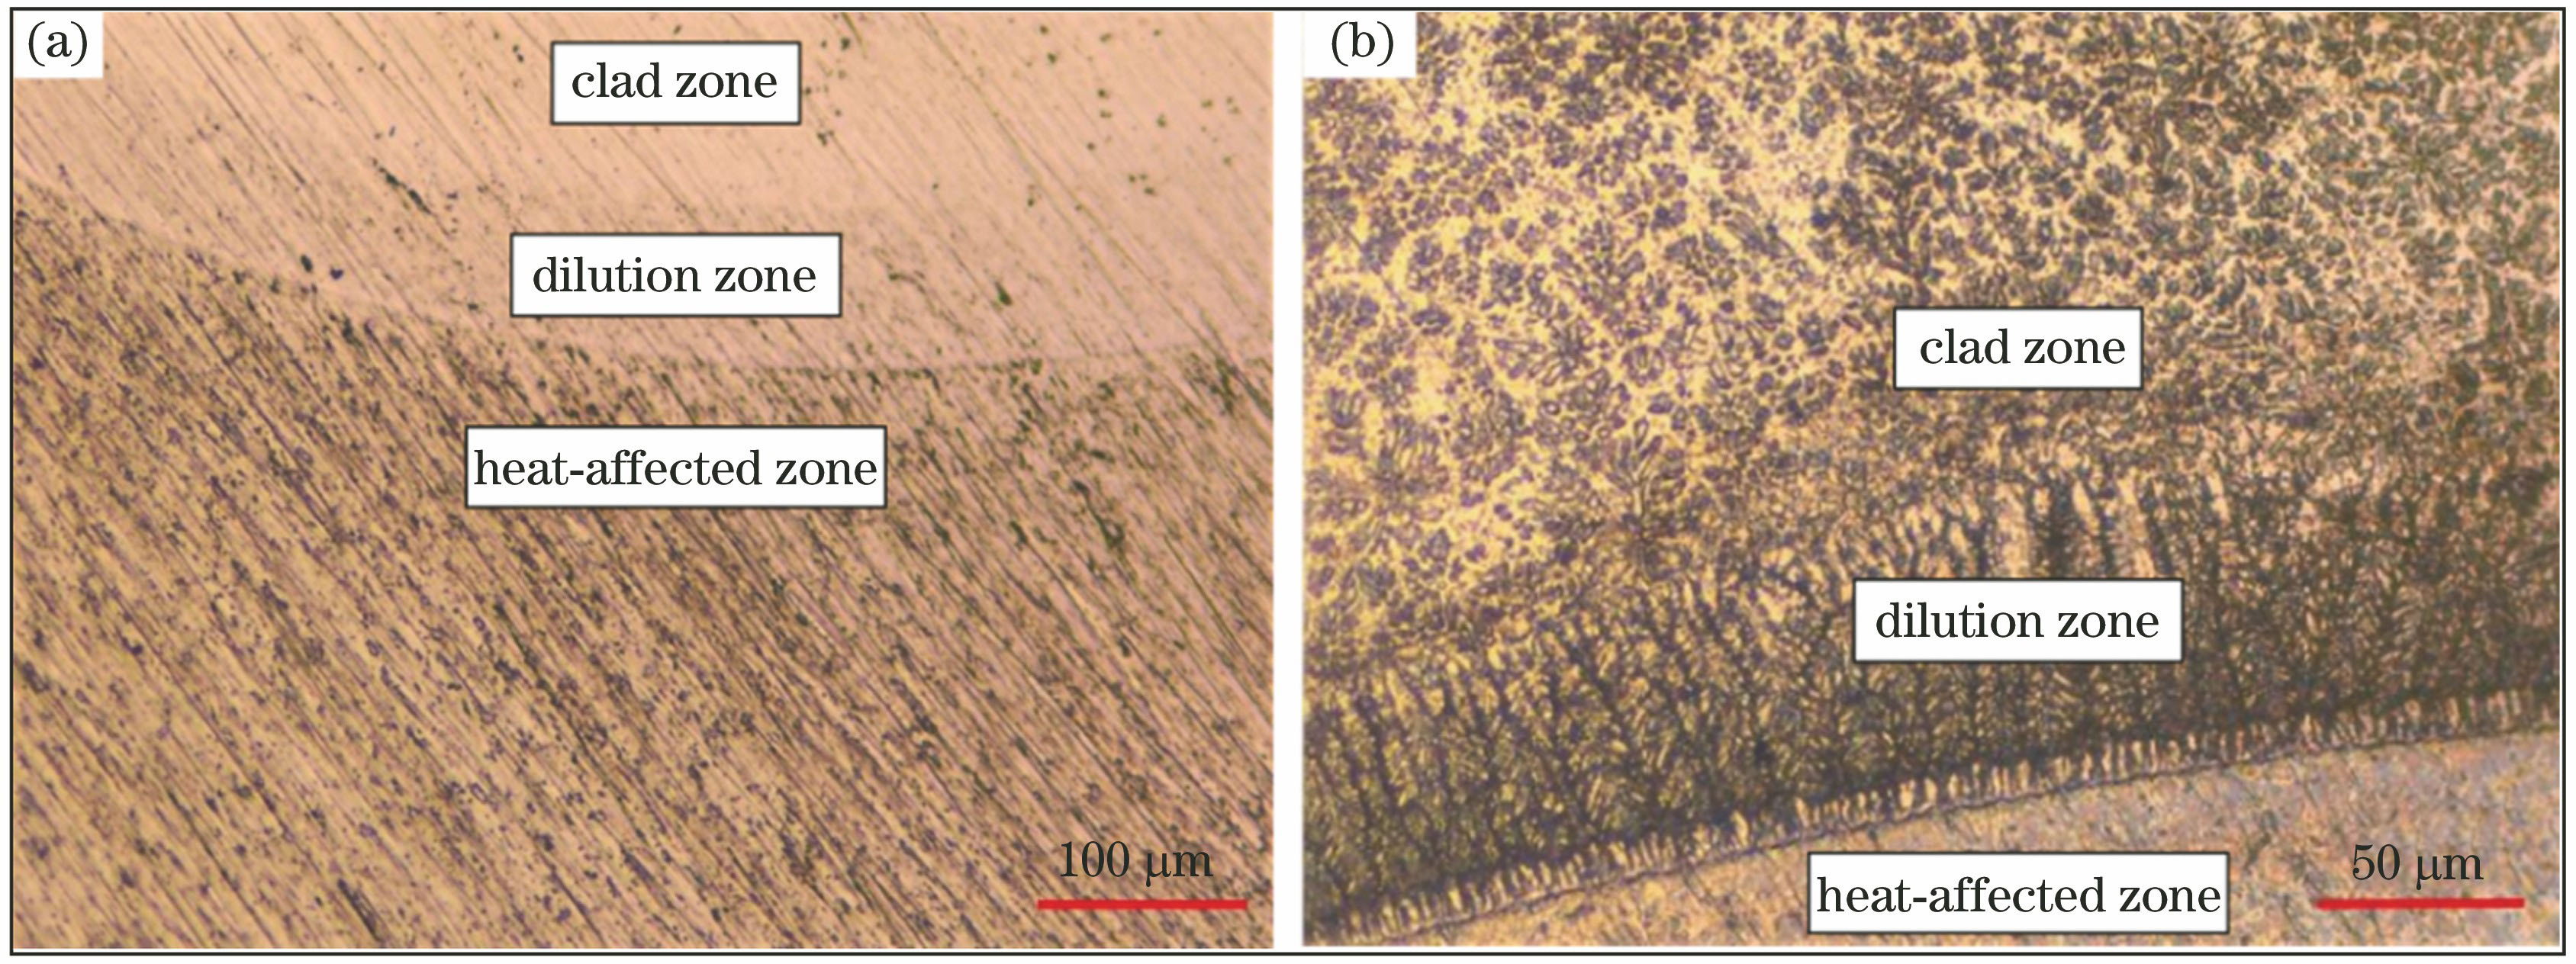
Fig. 1. Combination of cladding layer and matrix. (a) Topography; (b) metallographic diagram
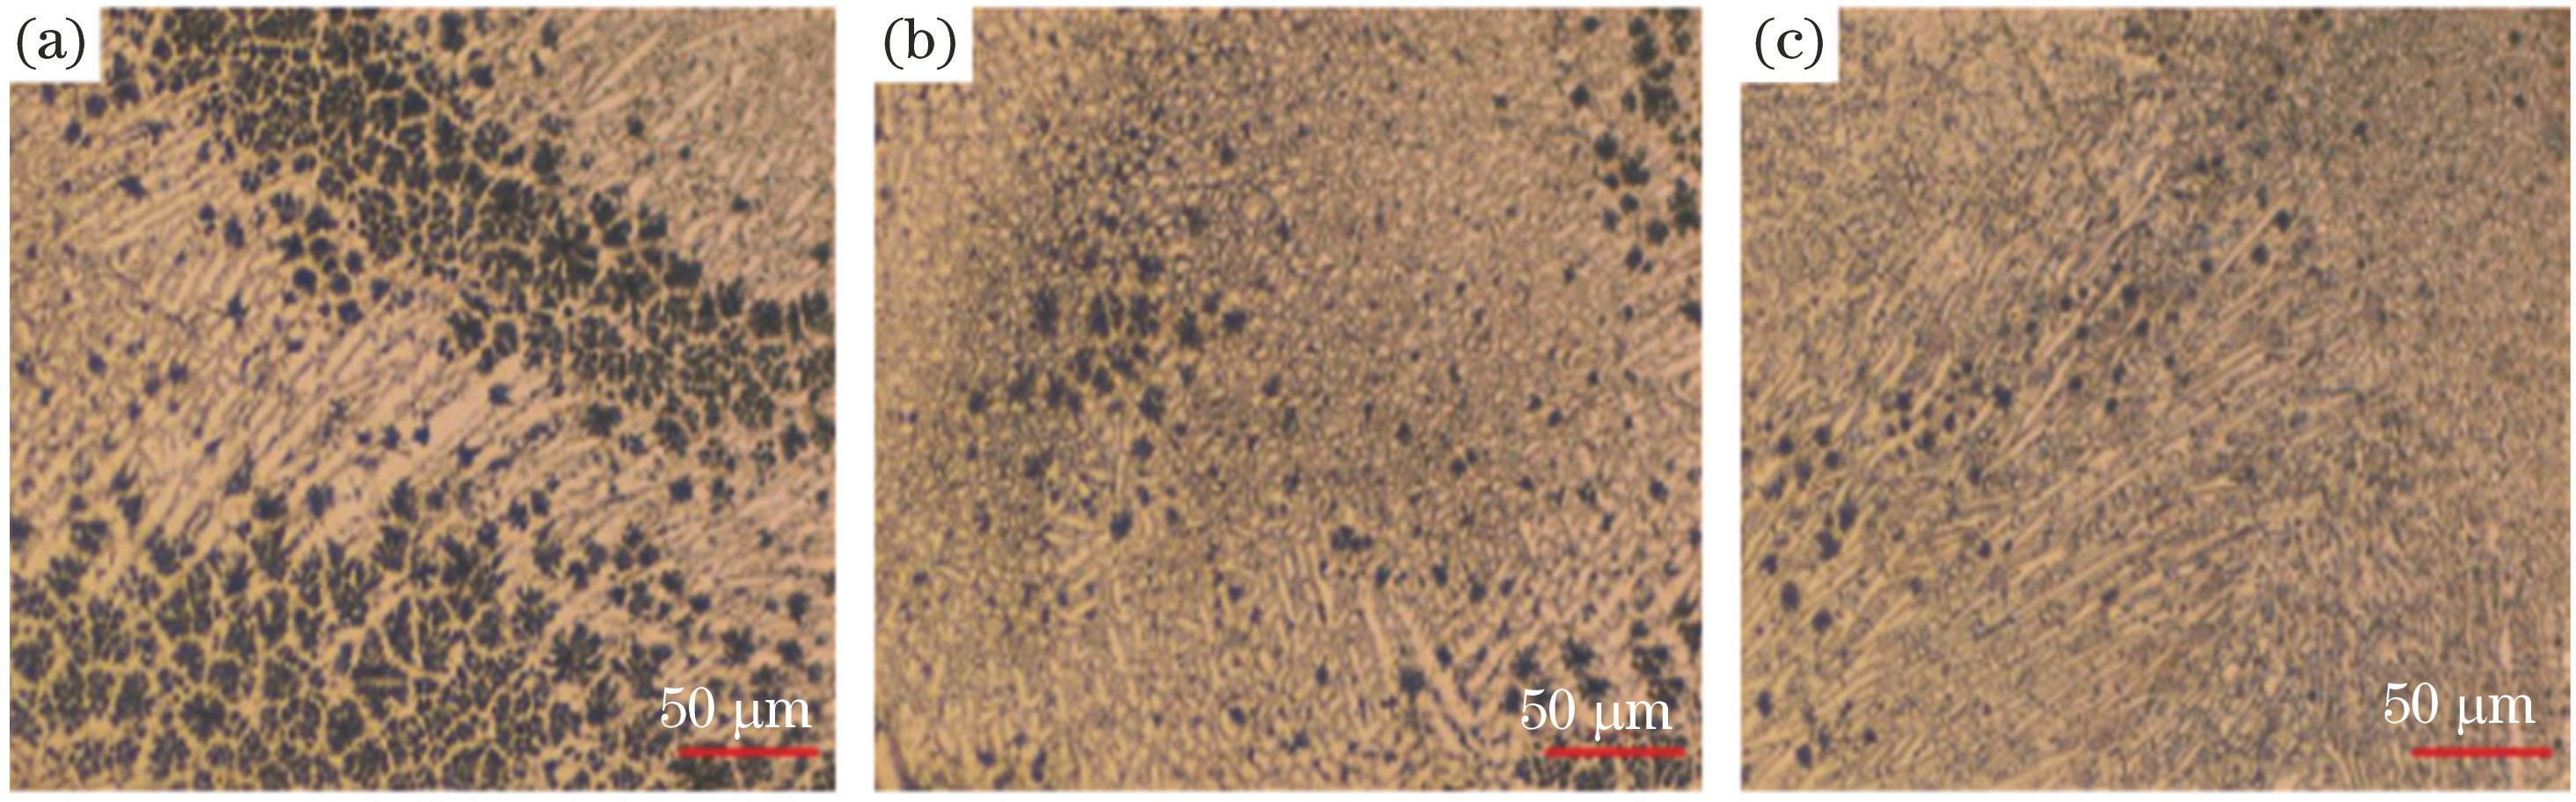
Fig. 2. Metallographic organization diagrams at P1 = 1000 W. (a) Surface layer of cladding layer; (b) inside of cladding layer; (c) adjacent substrate region
Fig. 3. Metallographic organization diagrams at P2=1300 W. (a) Surface layer of cladding layer; (b) inside of cladding layer; (c) adjacent substrate region
Fig. 4. Metallographic structure of P3=1600 W under different scales. (a)(b)(c) 50 μm; (d)(e) 20 μm
Fig. 5. Metallographic organization diagrams at P4=1900 W. (a) Adjacent substrate region; (b) central area of cladding layer
Fig. 6. Micromorphology of the cladding layer at different powers. (a) P2=1300 W; (b) P4=1900 W
Fig. 7. XRD pattern of cladding layer at different powers
Fig. 8. Microhardness diagrams. (a) Microhardness curves at different powers; (b) comparison of average hardness of matrix and each coating
|
Table 1. Chemical composition of the Ti-6Al-4V matrix
|
Table 2. Chemical composition of CoCrMo powder
|
Table 3. Technological parameters of laser cladding
| |||||||||||||||||||||||||||||||||||
Table 4. Cladding layer composition at P2=1300 W
| |||||||||||||||||||||||||||||||||||||||
Table 5. Cladding layer composition at P4=1900 W

Set citation alerts for the article
Please enter your email address
© Copyright 2018-2021 | Chinese Laser Press. All Rights Reserved 沪ICP备15018463号-20