
Runze Li, Xipu Dong, Jierong Cheng, Shengjiang Chang. Fast Optimization of High-Angular-Dispersion Wideband Dielectric Metagratings Based on Neural Networks[J]. Acta Optica Sinica, 2020, 40(23): 2305001
- Acta Optica Sinica
- Vol. 40, Issue 23, 2305001 (2020)
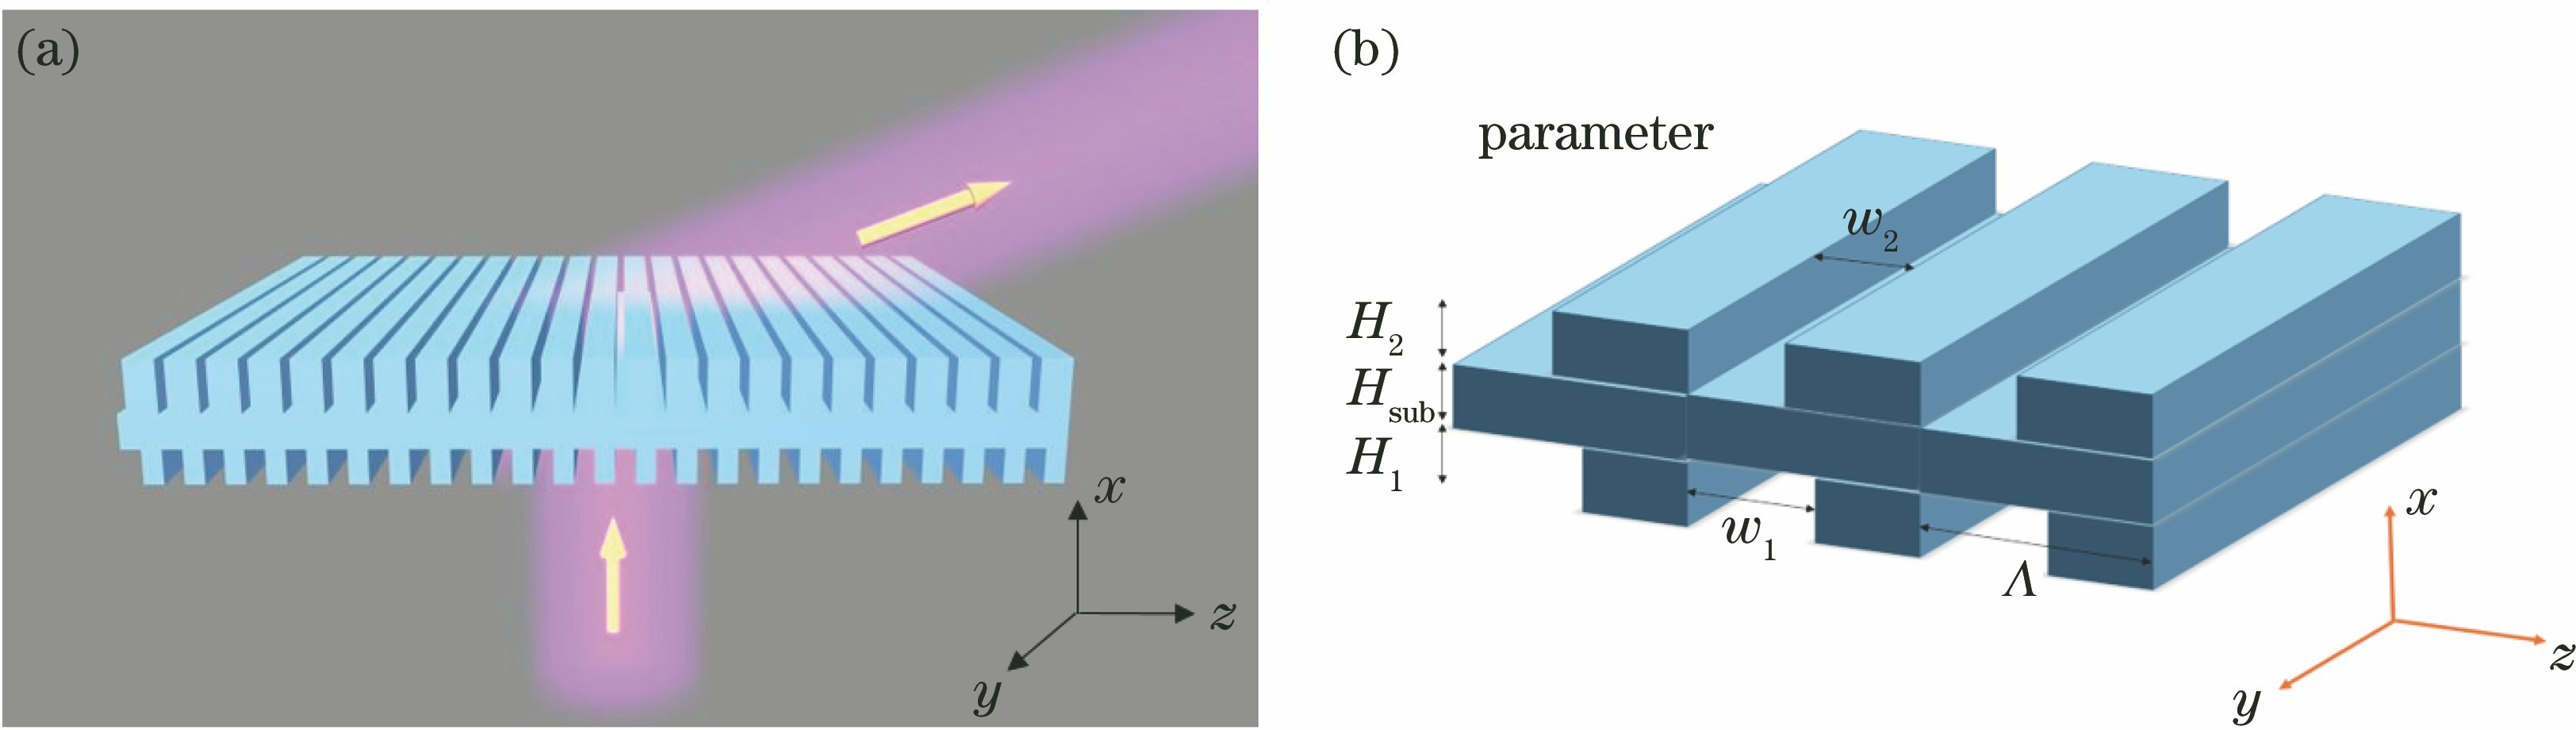
Fig. 1. Structural diagram of metagrating. (a) Structure and function; (b) structural parameters
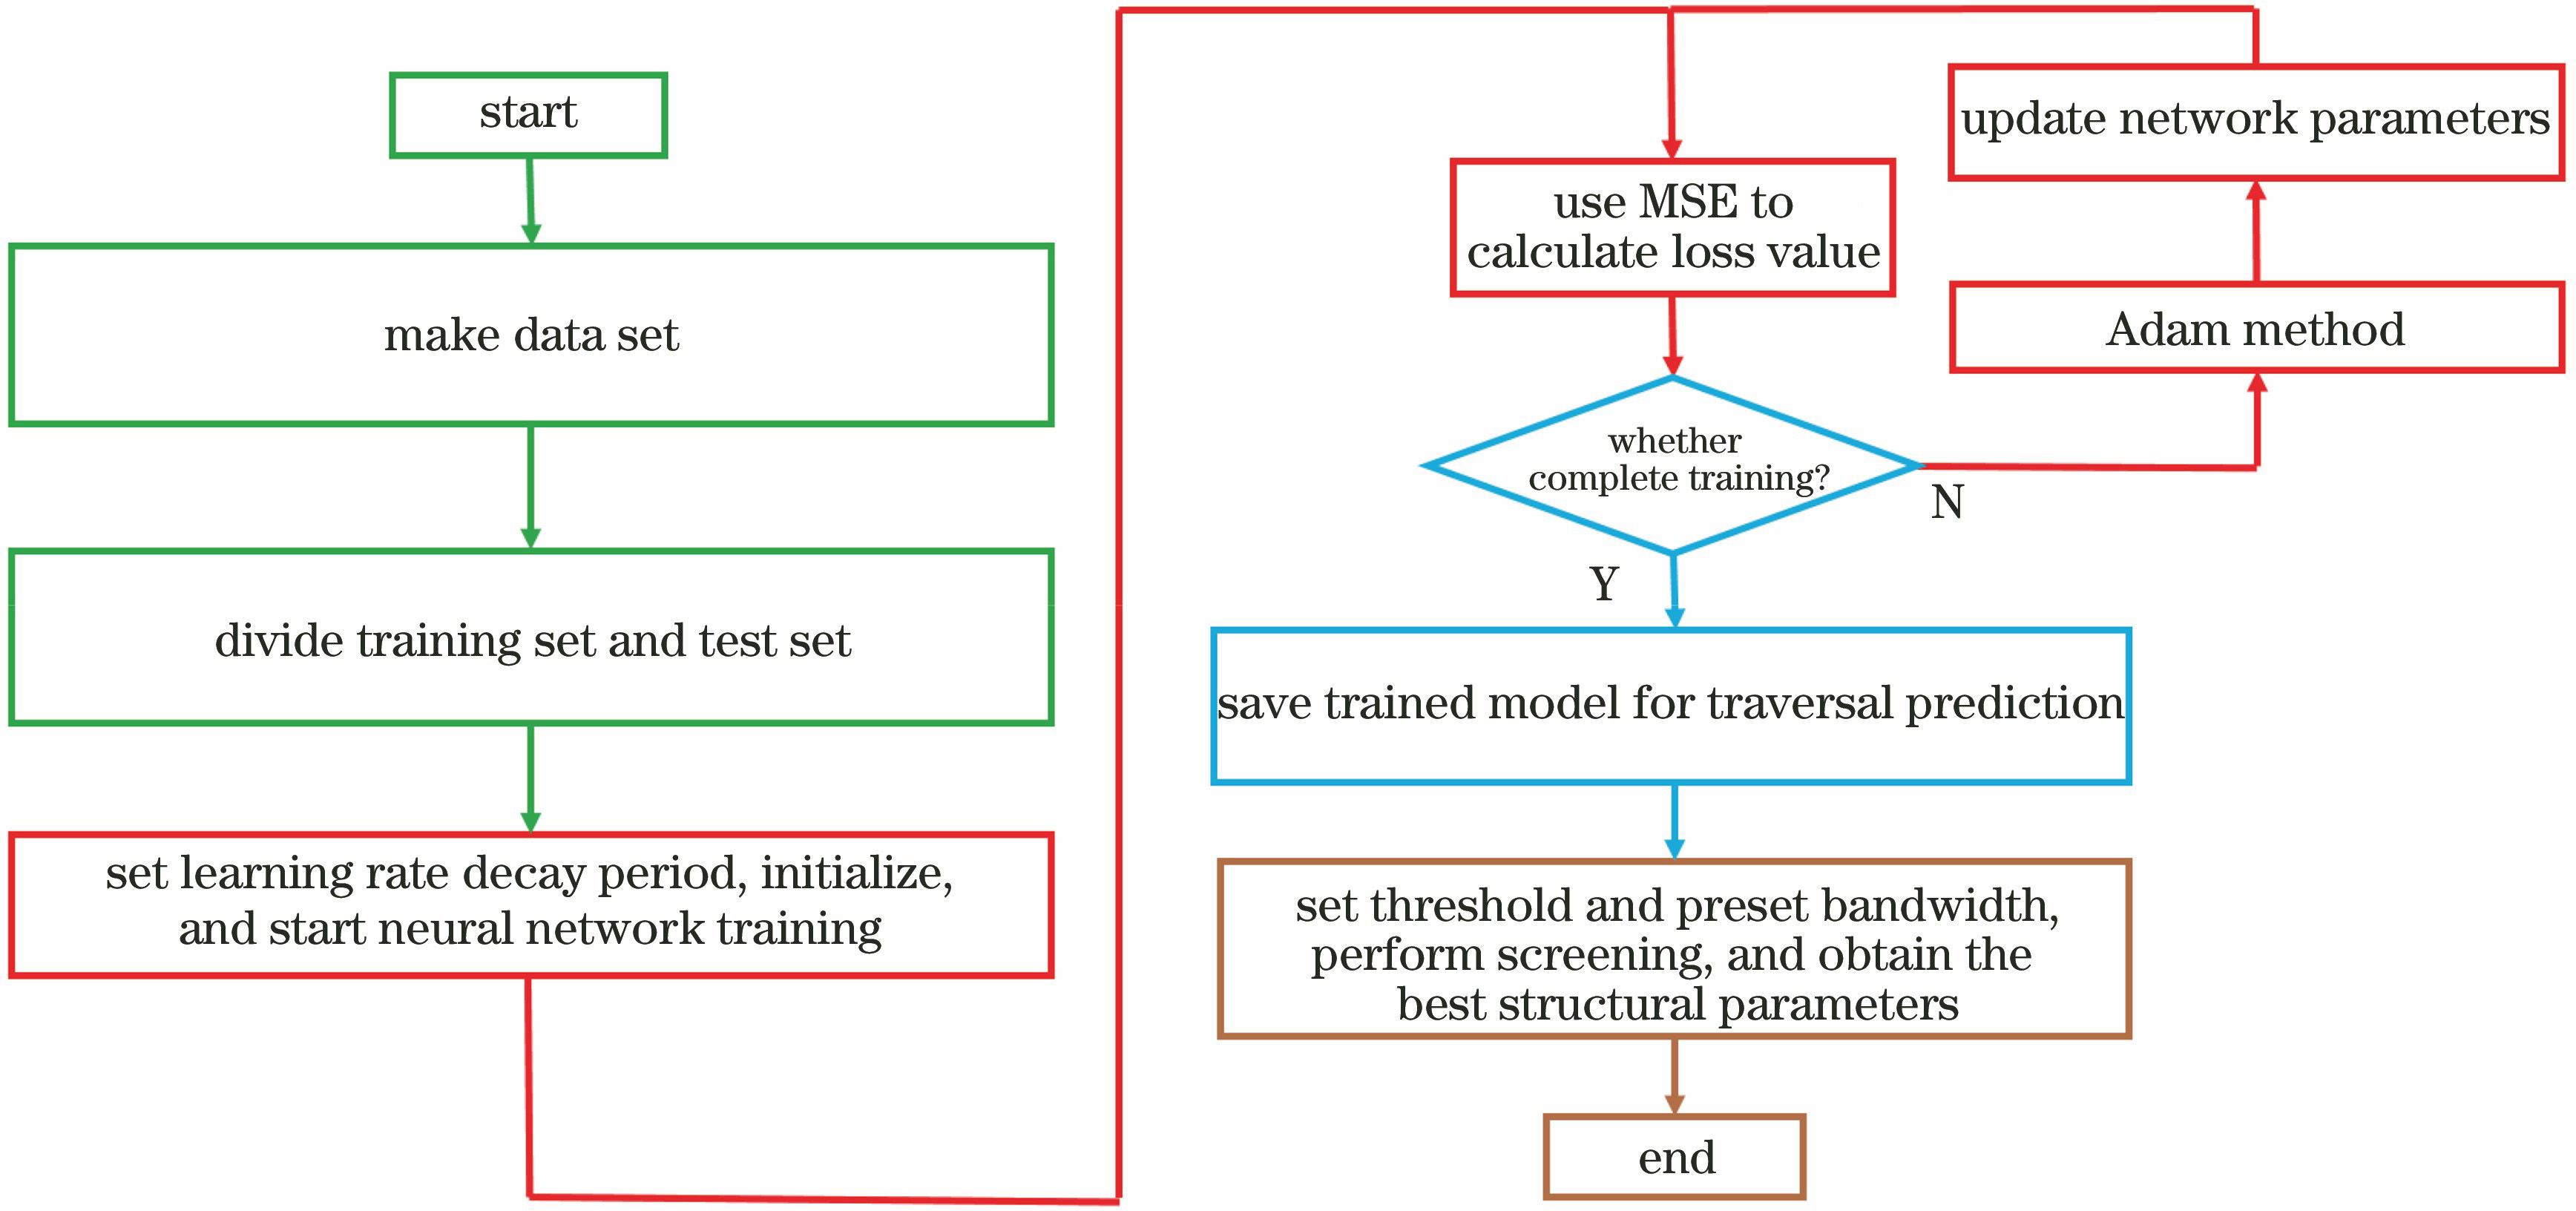
Fig. 2. Flow chart of grating optimization based on deep learning neural network
Fig. 3. Schematic of neural network training process
Fig. 4. [in Chinese]
Fig. 4. Parameter optimization process. (a) Relationship between A and Lloss when ep=1000 and ba=2500; (b) relationship between ep and Lloss when A=300 and ba=2500
Fig. 5. Predicted diffraction spectra and actual diffraction spectra of metagratings under different conditions. (a) W1=2.23 mm, W2=1.61 mm, H1=5.21 mm, H2=0.64 mm, Hsub=1.82 mm;(b) W1=1.94 mm, W2=1.70 mm, H1=2.09 mm, H2=1.20 mm, Hsub=3.07 mm;(c) W1=1.51 mm, W2=0.80 mm, H1=
Fig. 6. Diffraction spectrum of optimal metagrating screened based on neural network
Fig. 7. Diffraction characteristics of gratings. (a) Relationship between frequency and diffraction angle; (b) relationship between diffraction angle and diffraction efficiency
Fig. 8. Near-field distributions of metagrating at different frequencies. (a) 139.7 GHz; (b) 169.3 GHz
|
Table 1. Far field diffraction angle and intensity distributions

Set citation alerts for the article
Please enter your email address
© Copyright 2018-2021 | Chinese Laser Press. All Rights Reserved 沪ICP备15018463号-20