• Matter and Radiation at Extremes
  • Vol. 5, Issue 1, 018401 (2020)
Joseph Nilsen1、*, Andrea L. Kritcher1, Madison E. Martin1, Robert E. Tipton1, Heather D. Whitley1, Damian C. Swift1, Tilo Döppner1, Benjamin L. Bachmann1, Amy E. Lazicki1, Natalie B. Kostinski1, Brian R. Maddox1, Gilbert W. Collins2, Siegfried H. Glenzer3, and Roger W. Falcone4
Author Affiliations
  • 1Lawrence Livermore National Laboratory, Livermore, California 94551, USA
  • 2University of Rochester, Rochester, New York 14627, USA
  • 3SLAC National Accelerator, Menlo Park, California 94025, USA
  • 4University of California Berkeley, Berkeley, California 94720, USA
  • show less
    DOI: 10.1063/1.5131748 Cite this Article
    Joseph Nilsen, Andrea L. Kritcher, Madison E. Martin, Robert E. Tipton, Heather D. Whitley, Damian C. Swift, Tilo Döppner, Benjamin L. Bachmann, Amy E. Lazicki, Natalie B. Kostinski, Brian R. Maddox, Gilbert W. Collins, Siegfried H. Glenzer, Roger W. Falcone. Understanding the effects of radiative preheat and self-emission from shock heating on equation of state measurement at 100s of Mbar using spherically converging shock waves in a NIF hohlraum[J]. Matter and Radiation at Extremes, 2020, 5(1): 018401 Copy Citation Text show less
    (a) Schematic of the solid spherical CH target with Ge-doped GDP ablator used in the Gbar experiments. (b) Schematic of the experimental setup. Solid spherical target of CH is shock compressed using a hohlraum radiation drive, then backlit with ∼9 keV Zn He-α x-rays to generate a time-resolved (“streaked”) 1D image of the shock compression vs time. (c) Radiograph for the 9-keV x-ray backlighter vs time and radius, showing the shock wave converging to the central hot-spot. The vertical axis covers 8 ns and the horizontal axis covers a diameter of 0.2 cm. Details of the experiment are in Ref. 5.
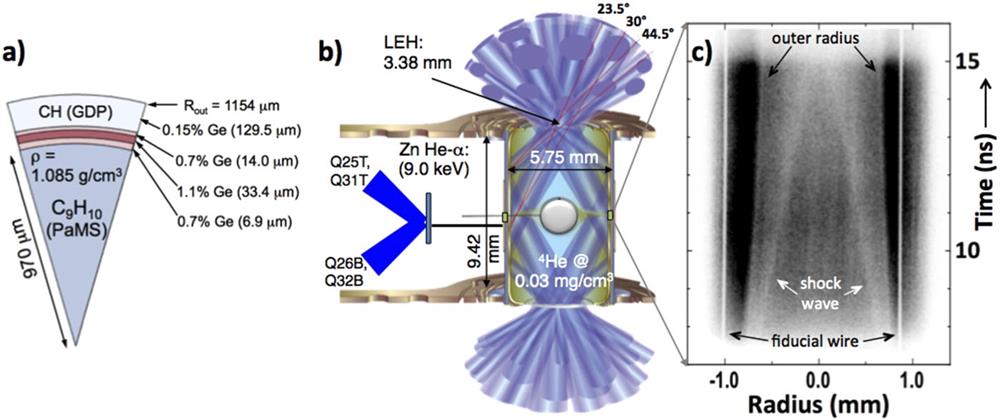
    Fig. 1. (a) Schematic of the solid spherical CH target with Ge-doped GDP ablator used in the Gbar experiments. (b) Schematic of the experimental setup. Solid spherical target of CH is shock compressed using a hohlraum radiation drive, then backlit with ∼9 keV Zn He-α x-rays to generate a time-resolved (“streaked”) 1D image of the shock compression vs time. (c) Radiograph for the 9-keV x-ray backlighter vs time and radius, showing the shock wave converging to the central hot-spot. The vertical axis covers 8 ns and the horizontal axis covers a diameter of 0.2 cm. Details of the experiment are in Ref. 5.
    Simulated radiation temperature vs time inside the radiation cavity (hohlraum) comparing the cases for high- (red) and low-drive (blue) Gbar experiments.
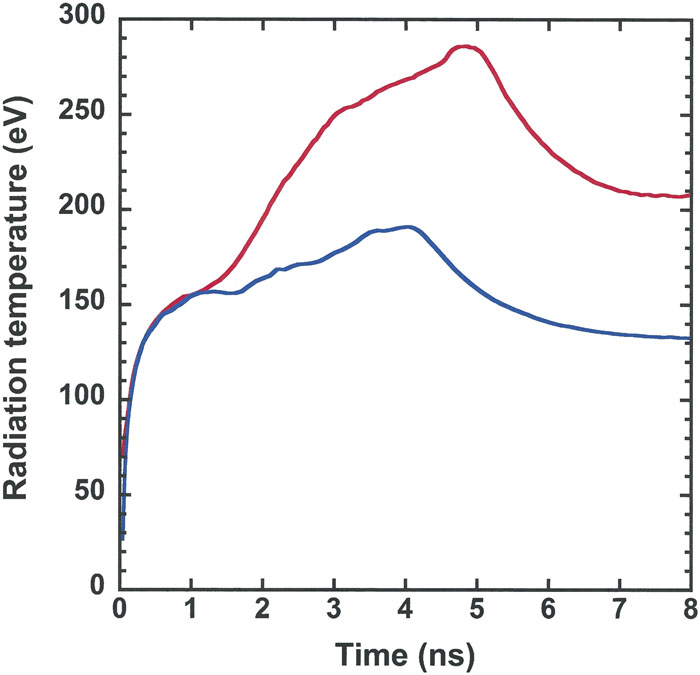
    Fig. 2. Simulated radiation temperature vs time inside the radiation cavity (hohlraum) comparing the cases for high- (red) and low-drive (blue) Gbar experiments.
    Pressure at the shock front vs shock radius for low-drive Gbar simulations of a solid CH target. Pressure begins to increase steeply as the shock converges to radii of less than 200 μm.
    Fig. 3. Pressure at the shock front vs shock radius for low-drive Gbar simulations of a solid CH target. Pressure begins to increase steeply as the shock converges to radii of less than 200 μm.
    Snapshots of the simulated density (black) and pressure (red) vs the radius of the CH spherical target for the low-drive Gbar simulations at 10.3 and 14.0 ns. At an early time and large radius (solid), the pressure and density peak at the shock front. As the shock converges towards the center (dotted) there is a significant pileup in the density behind the shock.
    Fig. 4. Snapshots of the simulated density (black) and pressure (red) vs the radius of the CH spherical target for the low-drive Gbar simulations at 10.3 and 14.0 ns. At an early time and large radius (solid), the pressure and density peak at the shock front. As the shock converges towards the center (dotted) there is a significant pileup in the density behind the shock.
    The solid black line shows pressure vs density for the Hugoniot from the tabular EOS table LEOS 5400. The red curve represents the values of pressure and density extracted from the radiation-hydrodynamic simulations for the low-drive Gbar simulation of a solid CH target. There is excellent agreement, within 0.2%, over the pressure range of 50–130 Mbar.
    Fig. 5. The solid black line shows pressure vs density for the Hugoniot from the tabular EOS table LEOS 5400. The red curve represents the values of pressure and density extracted from the radiation-hydrodynamic simulations for the low-drive Gbar simulation of a solid CH target. There is excellent agreement, within 0.2%, over the pressure range of 50–130 Mbar.
    Pressure at the shock front vs shock radius for the high-drive Gbar simulations of a solid CH target. Pressure begins to increase steeply as the shock converges to radii of less than 200 μm.
    Fig. 6. Pressure at the shock front vs shock radius for the high-drive Gbar simulations of a solid CH target. Pressure begins to increase steeply as the shock converges to radii of less than 200 μm.
    The solid black line shows pressure vs density for the Hugoniot from the tabular EOS table LEOS 5400. The dotted lines are the Hugoniot for LEOS 5400, with initial temperatures 1–5 eV, with 1 eV being closest to the solid curve. The red curve represents the values of pressure and density extracted from the radiation-hydrodynamic simulations for the high-drive Gbar simulation of a solid CH target. The simulation initially lies on a preheated Hugoniot between 3 and 4 eV.
    Fig. 7. The solid black line shows pressure vs density for the Hugoniot from the tabular EOS table LEOS 5400. The dotted lines are the Hugoniot for LEOS 5400, with initial temperatures 1–5 eV, with 1 eV being closest to the solid curve. The red curve represents the values of pressure and density extracted from the radiation-hydrodynamic simulations for the high-drive Gbar simulation of a solid CH target. The simulation initially lies on a preheated Hugoniot between 3 and 4 eV.
    The solid black line shows pressure vs density for the Hugoniot from tabular EOS table LEOS 5400. The red curve represents the values of pressure and density extracted from the radiation-hydrodynamic simulations using the full FDS source for the high-drive Gbar simulation of a solid CH target. The blue curve uses an equivalent black-body source to drive the CH target, while the green dotted curve uses the full FDS source but zeroes out the opacity in front of the shock to eliminate the effects of preheating and radiative heating from the shock on unshocked material.
    Fig. 8. The solid black line shows pressure vs density for the Hugoniot from tabular EOS table LEOS 5400. The red curve represents the values of pressure and density extracted from the radiation-hydrodynamic simulations using the full FDS source for the high-drive Gbar simulation of a solid CH target. The blue curve uses an equivalent black-body source to drive the CH target, while the green dotted curve uses the full FDS source but zeroes out the opacity in front of the shock to eliminate the effects of preheating and radiative heating from the shock on unshocked material.
    Snapshots of the simulated electron temperature vs the radius of the CH spherical target for the high-drive Gbar simulations, when the shock reaches a 744-μm radius at time 5.0 ns. The red curve is the baseline simulation using the full FDS source, while the black curve is the same simulation with the opacity zeroed out in front of the shock to eliminate radiation heating effects. Radiation heating from the preheating heats unshocked material to temperatures of about 4 eV in front of the shock.
    Fig. 9. Snapshots of the simulated electron temperature vs the radius of the CH spherical target for the high-drive Gbar simulations, when the shock reaches a 744-μm radius at time 5.0 ns. The red curve is the baseline simulation using the full FDS source, while the black curve is the same simulation with the opacity zeroed out in front of the shock to eliminate radiation heating effects. Radiation heating from the preheating heats unshocked material to temperatures of about 4 eV in front of the shock.
    Snapshots of the simulated density vs the radius of the CH spherical target for the high-drive Gbar simulations when the shock reaches a 744-μm radius at time 5.0 ns. The red curve is the baseline simulation using the full FDS source, while the black curve is the same simulation with the opacity zeroed out in front of the shock to eliminate radiation heating effects. The density is about 2% lower in the preheated case.
    Fig. 10. Snapshots of the simulated density vs the radius of the CH spherical target for the high-drive Gbar simulations when the shock reaches a 744-μm radius at time 5.0 ns. The red curve is the baseline simulation using the full FDS source, while the black curve is the same simulation with the opacity zeroed out in front of the shock to eliminate radiation heating effects. The density is about 2% lower in the preheated case.
    Snapshot of the simulated pressure vs the radius of the CH spherical target for the high-drive Gbar simulations when the shock reaches an 89-μm radius at time 8.8 ns. The red curve is the baseline simulation using the full FDS source, while the black curve is the same simulation with the opacity zeroed out in front of the shock to eliminate radiation heating effects.
    Fig. 11. Snapshot of the simulated pressure vs the radius of the CH spherical target for the high-drive Gbar simulations when the shock reaches an 89-μm radius at time 8.8 ns. The red curve is the baseline simulation using the full FDS source, while the black curve is the same simulation with the opacity zeroed out in front of the shock to eliminate radiation heating effects.
    Snapshots of the simulated electron temperature vs the radius of the CH spherical target for the high-drive Gbar simulations when the shock reaches an 89-μm radius at time 8.8 ns. The red curve is the baseline simulation using the full FDS source, while the black curve is the same simulation with the opacity zeroed out in front of the shock to eliminate radiation heating effects. Radiation heating from the shock heats the unshocked material to temperatures exceeding 50 eV in front of the shock.
    Fig. 12. Snapshots of the simulated electron temperature vs the radius of the CH spherical target for the high-drive Gbar simulations when the shock reaches an 89-μm radius at time 8.8 ns. The red curve is the baseline simulation using the full FDS source, while the black curve is the same simulation with the opacity zeroed out in front of the shock to eliminate radiation heating effects. Radiation heating from the shock heats the unshocked material to temperatures exceeding 50 eV in front of the shock.
    Snapshots of the simulated density vs the radius of the CH spherical target for the high-drive Gbar simulations when the shock reaches an 89-μm radius at time 8.8 ns. The red curve is the baseline simulation using the full FDS source, while the black curve is the same simulation with the opacity zeroed out in front of the shock to eliminate radiation heating effects. The density has dropped significantly at the shock front due to radiative heating.
    Fig. 13. Snapshots of the simulated density vs the radius of the CH spherical target for the high-drive Gbar simulations when the shock reaches an 89-μm radius at time 8.8 ns. The red curve is the baseline simulation using the full FDS source, while the black curve is the same simulation with the opacity zeroed out in front of the shock to eliminate radiation heating effects. The density has dropped significantly at the shock front due to radiative heating.
    Time (ns)Radius (μm)Pressure (Mbar)
    8.8560039
    10.2750040
    11.6440045
    12.9130054
    14.0420073
    14.96100132
    Table 1. Pressure at shock front vs time and radius for low-drive Gbar simulation.
    Time (ns)Radius (μm)Pressure (Mbar)
    4.58800130
    5.33700155
    6.02600181
    6.67500208
    7.27400235
    7.84300280
    8.35200373
    8.76100638
    8.8574807
    8.92491122
    Table 2. Pressure at shock front vs time and radius for high-drive Gbar simulation.
    Joseph Nilsen, Andrea L. Kritcher, Madison E. Martin, Robert E. Tipton, Heather D. Whitley, Damian C. Swift, Tilo Döppner, Benjamin L. Bachmann, Amy E. Lazicki, Natalie B. Kostinski, Brian R. Maddox, Gilbert W. Collins, Siegfried H. Glenzer, Roger W. Falcone. Understanding the effects of radiative preheat and self-emission from shock heating on equation of state measurement at 100s of Mbar using spherically converging shock waves in a NIF hohlraum[J]. Matter and Radiation at Extremes, 2020, 5(1): 018401
    Download Citation