
El-Megharbel Samy M., Refat Moamen S.. In First Time: Synthesis and Spectroscopic Interpretations of Manganese(Ⅱ), Nickel(Ⅱ) and Mercury(Ⅱ) Clidinium Bromide Drug Complexes[J]. Spectroscopy and Spectral Analysis, 2021, 41(10): 3316
- Spectroscopy and Spectral Analysis
- Vol. 41, Issue 10, 3316 (2021)
Abstract
Introduction
Clidinium bromide is an anticholinergic drug which may help symptoms of cramping and abdominal stomach pain by decreasing stomach acid and slowing the intestines. It is commonly prescribed in combination with chlordiazepoxide by the name of clidinium-c[
1 Experimental
1.1 Synthesis of Mn(Ⅱ), Ni(Ⅱ) and Hg(Ⅱ) clidinium drug complexes
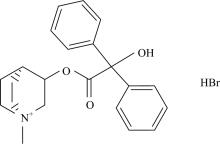
All chemicals that were used were of analytical grade where possible and were purchased from Aldrich and Merck Companies. Clidinium bromide drug (Fig.1) was received from Egyptian International Pharmaceutical Industrial Company (EIPICo.). The clidinium bromide complexes were prepared by mixing twice amount of clidinium bromide drug (2 mmol) and 1 mmol of anhydrous metal(Ⅱ) chlorides Mn(Ⅱ), Ni(Ⅱ) and Hg(Ⅱ) in mixed solvent MeOH/H2O (50/50, w/w; 40 cm3), then pH of the solution was adjusted to 6~8 using 5% solution of alcoholic ammonia solution, then the mixtures reaction were stirred at 70 ℃ for 4hrs and left to stand overnight. The resulted precipitates were filtered off, washed with MeOH and then dried under vacuum over anhydrous CaCl2.
![]()
Figure 1.Chemical structure of clidinium bromide drug
1.2 Instruments
The C, H and N percentage determined using Vario EL Fab. CHNS. Metal content and water percentage were determined by gravimetrically technique. IR spectral data for synthesized complexes were measured using infrared Bruker spectrophotometer ranged between 400~4 000 cm-1. The conductance measurements with concentration of 10-3 mol·L-1 for synthesized complexes in dimethyl sulfoxide solvent measured using HACH conductivity meter model. 1H-NMR was recorded as dimethyl sulfoxide solutions on a Bruker 600 MHz spectrometer using tetramethyl silane as the internal standard. The electronic absorption spectra were recorded in DMSO solvent within 900~200 nm range using a UV2 Unicam UV/Vis Spectrophotometer fitted with a quartz cell of 1.0 cm path length. The X-ray diffraction patterns were recorded on X ’Pert PRO PANanalytical X-ray powder diffraction, target copper with secondary monochromate. Magnetic susceptibility measurements were performed on a SHERWOOD SCIENTIFIC magnetic susceptibility balance. The surface morphologies for particles of complexes were visualized using a Quanta FEG 250 scanning electron microscope (SEM)generated at 20 kV accelerating voltage, where the shapes and sizes of these particles were visualized using a JEOL JEM-1200 EX Ⅱ.
2 Results and Discussion
2.1 Microanalytical and Molar conductance data
Analytical data listed in (Table 1) indicate that Metal:Ligand stoichiometry is (1:2) i.e the probable general formulas of the complexes are [M(C22H25NO3)2(H2O)4] and [Hg(C22H25NO3)2(H2O)2] where M=Mn (Ⅱ) and Ni(Ⅱ) (Fig.2). All the complexes melt above >250 ℃ temperature. The prepared complexes are insoluble in water and poorly soluble in common organic solvents, but fairly soluble in DMSO and DMF. The molar conductance values lie in the range of 30~43 Ω-1·cm2·mol-1 at 25 ℃. Low molar conductance values of 10-3 mol·L-1 solutions in DMSO showed them to be non-electrolytes.
![]()
Figure 2.Speculated structures of Mn(Ⅱ), Ni(Ⅱ), and Hg(Ⅱ) clidinium complexes
These data convenient with the calculated elemental analysis that Cl- ions were not detected by addition of AgNO3 solution to the solutions of the mentioned complexes dissolved in nitric acid.
2.2 Electronic spectra
The UV spectrum of the free clidinium bromide drug show a characteristic band at 43 860 cm-1. This band is attributed to intra ligand transitions. In the complexes the bands show the blue shift in their positions. Manganese(Ⅱ) complex has magnetic moment value of 5.54 B.M. suggesting octahedral environment. The electronic spectra of Mn(Ⅱ) complex has two bands at 22 222 cm-1 and 18 182 cm-1, which attributed to 6A1g→4T2g (G) and 6A1g→4T1g (G) transitions of Mn(Ⅱ) ion in a spin free d5 configuration confirming to octahedral arrangement[
2.3 Infrared spectra
The distinguish IR spectral bands of clidinium bromide (Table 2) shows a band at 3226 cm-1 assigned to the OH group stretching frequency, this band ν(O—H) stretching vibration motion is disappeared in case of the infrared spectra of the Mn(Ⅱ), Ni(Ⅱ), and Hg(Ⅱ) complexes [Fig.3(a—c)]. This suggests the involvement of the oxygen atom of the deprotonated OH group of clidinium ligand in complexation. The intense infrared band at 1 750 cm-1 which assigned to ν(C=O) vibrations[
![]()
Figure 3.IR Spectrum of Ni(Ⅱ) clidinium complex
![]()
Figure 4.1H-NMR spectrum of Hg(Ⅱ) clidinium complex
![]()
Figure 5.XRD spectrum of Hg(Ⅱ) clidinium complex
2.4 1H-NMR spectra
The 1H-NMR spectral results of the clidinium bromide ligand in (DMSO-d6) has a characteristic signal at chemical shifts 1.93~5.21 ppm and 7.28~7.43 ppm due to the aliphatic and aromatic protons respectively. The proton NMR spectrum for clidinium bromide show a singlet peak at 3.65 ppm due to proton of hydroxyl group. This singlet peak isn’t observed in the spectrum of mercury(Ⅱ) complex (Fig.4) that can be assigned to the deprotonation of OH group and participated in the complexation. The disappearance of the signal of the proton of the hydroxyl group in the 1H-NMR spectrum of the complex confirms that the hydroxyl group contribute in the complexation between clidinium and Hg(Ⅱ) ion, therefore, the hydroxyl group is disappear in the complex of clidinium moiety. So these results confirm the position of chelation which discussed above between two molecules of clidinium with Hg(Ⅱ) ion.
![]()
Figure 6.SEM image of Hg(Ⅱ) clidinium complex
2.5 X-ray powder diffraction patterns and SEM studies
The XRD powder pattern analysis of the [Hg(C22H25NO3)2(H2O)2] complex (Fig.5) has been performed using X-ray diffractometer with Cu as anode material, K-alpha [nm]=0.154 178, and the generator settings 30 mA, 40 kV.
The Debye-Scherrer equation in X-ray diffraction and crystallography is a formula which relates the size of the crystallites in a solid to the broadening of a peak in a diffraction pattern. The Debye-Scherrer equation is B=kλ/scosθ, where s=crystallite size, λ=wavelength of X-ray radiation (CuKα=0.154 178 nm), k=constant taken as 0.94, θ=diffraction angle (5.494 7°), and B=full width at half maximum height (FWHM) (0.250 9°). The crystallite size of the mercury (Ⅱ) clidinium complex is found to be 33 nm. Line broadening of the crystalline diffraction peak in the Hg(Ⅱ) complex showed higher crystallinity. The SEM analysis was carried out to check the surface morphology of the selected Hg(Ⅱ) complex and the micrographs obtained are given in Fig.6. The micrograph of Hg(Ⅱ) complex indicated that the presence of well defined crystals free from any shadow of the metal ion on their external surface had a stones like morphology. It is evident from the SEM study that in the synthesized metal complex, crystals were found to grow up from just a single molecule to several molecules in an aggregate distribution with particle sizes starting from a few nanometers to several hundred.
References
[1] N Lara, P Richter, I Toral M et al. Inter. J. Pharma, 189, 67(1999).
[2] M Michael A, K Nessim C, M Fayez Y et al. Chromatographia, 80, 911(2017).
[3] A Adam A M, S Refat M, A Saad H et al. J. Mol. Liq., 216, 192(2016).
[4] S Ashour, N Kattan. Pharmaceutics, 2013, 1(2013).
[5] T Ardakani Z, R Shishehbore M, A Sheibani. Chinese Chemical Letters, 22, 595(2011).
[6] K Mcevory G. AHFS Drug Information, American Society of Hospital Pharmacists(1990).
[7] J Zimak, J Gasparic. J. Pharm. Biomed. Anal., 1, 259(1983).
[8] Z Senkowski B, C Rudy B. Clidinium Bromide. in Analytical Profiles of Drug Substances, K. Florey, Ed., 2, 145(1973).
[9] . United States Pharmacopoeia, United States Pharmacopoeia Convention, Rockville, Md, USA, 34th Edition(2011).
[10] A Pathak, J Rajput S, P Rai. Chromatographic Science, 48, 235(2010).
[11] M Yuen S, G Lehr. Journal of the Association of Official Analytical Chemists, 74, 461(1991).
[12] M Jalal I, A Hussein, I Sasa S et al. Analytical Letters, 20, 635(1987).
[13] I Toral M, P Richter, N Lara et al. International Journal of Pharmaceutics, 189, 67(1999).
[14] P Lever A B. Inorganic Electronic Spectroscopy; Elsevier: Amsterdam, The Netherlands, 385(1986).
[15] K Nakamoto. InfraRed Spectra of Inorganic and Coordinated Compounds, John Wiley, New York, 167(1963).

Set citation alerts for the article
Please enter your email address
© Copyright 2018-2021 | Chinese Laser Press. All Rights Reserved 沪ICP备15018463号-20