• Laser & Optoelectronics Progress
  • Vol. 60, Issue 7, 0730005 (2023)
Wuyao Li1, Mamat Sawut1、2、3、*, and Maihemuti Balati1、2、3
Author Affiliations
  • 1College of Geography and Remote Sensing Science, Xinjiang University, Urumqi 830046, Xinjiang, China
  • 2Xinjiang Key Laboratory of Oasis Ecology, Urumqi 830046, Xinjiang, China
  • 3Key Laboratory of Smart City and Environment Modelling of Higher Education Institute, Urumqi 830046, Xinjiang, China
  • show less
    DOI: 10.3788/LOP220715 Cite this Article Set citation alerts
    Wuyao Li, Mamat Sawut, Maihemuti Balati. Fractional Differential-Based Hyperspectral Inversion of Soil Organic Matter Content[J]. Laser & Optoelectronics Progress, 2023, 60(7): 0730005 Copy Citation Text show less
    Geographical position of study area and distribution of sampling
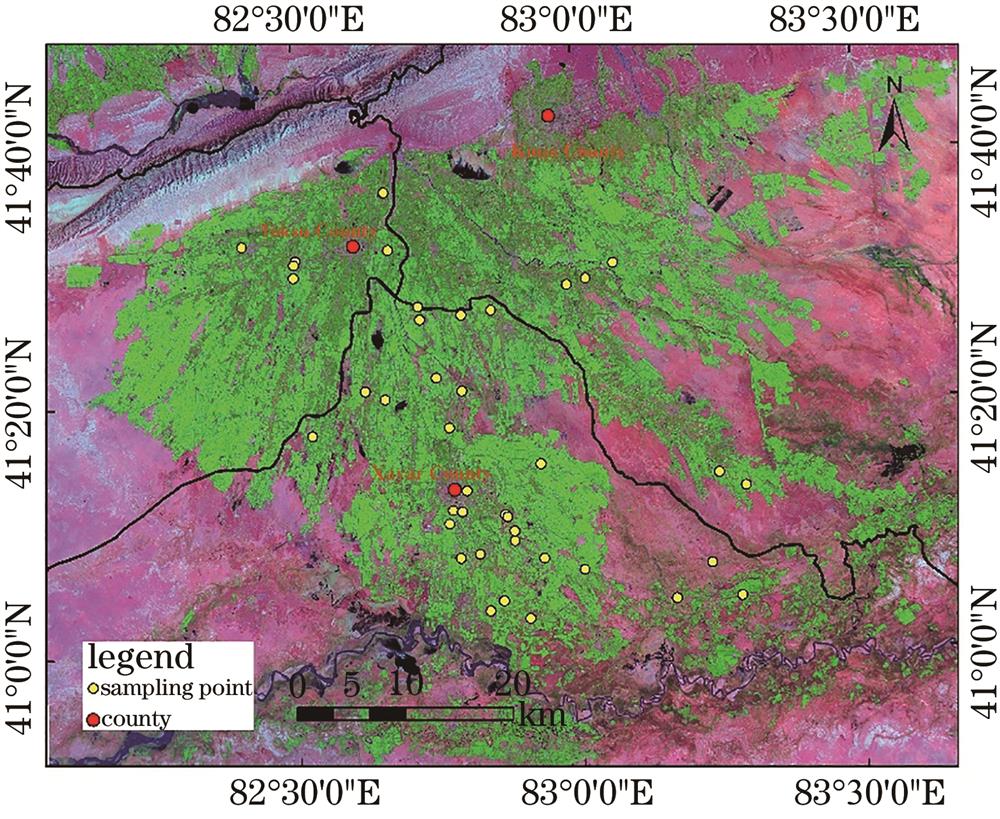
    Fig. 1. Geographical position of study area and distribution of sampling
    Reflectance curves of soil with different organic matter contents
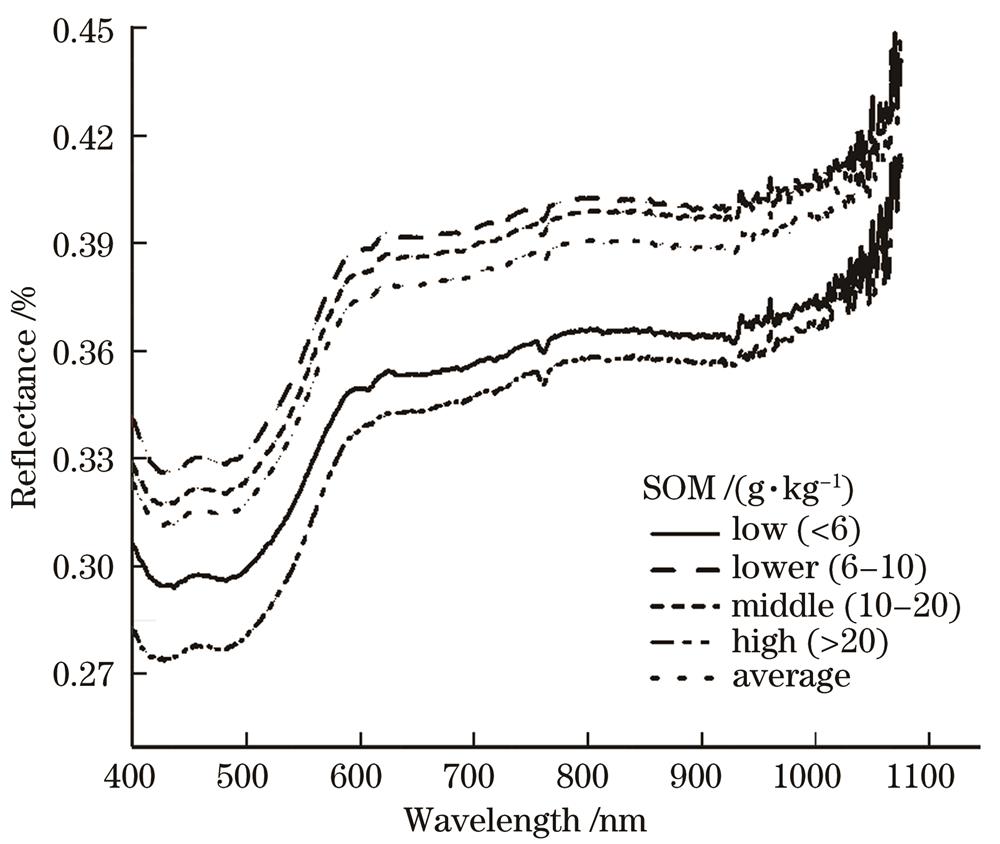
    Fig. 2. Reflectance curves of soil with different organic matter contents
    Correlation coefficient between SOM content and spectral reflectance transform form. (a) 1-order differential; (b) 1.2-order differential; (c) 1.4-order differential; (d) 1.6-order differential; (e) 1.8-order differential; (f) 2-order differential
    Fig. 3. Correlation coefficient between SOM content and spectral reflectance transform form. (a) 1-order differential; (b) 1.2-order differential; (c) 1.4-order differential; (d) 1.6-order differential; (e) 1.8-order differential; (f) 2-order differential
    Optimal mathematical transformation form of SOM results in the three models. (a) 1-order differential of SVR model; (b) 1-order differential of PLSR model; (c) 1.2-order differential of RF model
    Fig. 4. Optimal mathematical transformation form of SOM results in the three models. (a) 1-order differential of SVR model; (b) 1-order differential of PLSR model; (c) 1.2-order differential of RF model
    Sample typeQuantityMaxMinMeanStandard deviationCV /%
    Calibration4925.4162.75811.6025.43646.86
    Validation2424.1332.74212.5315.81046.37
    Totality7325.4162.74211.9595.60146.84
    Table 1. SOM content statistical characteristics of study area samples
    Spectral transformationCharacteristic band /nmNumber of wavelengthsr
    0/0/
    0.2/0/
    0.4/0/
    0.6/0/
    0.8399、43520.293、0.316
    1588、597、630、648、675、792、855、101380.308、0.323、0.290、-0.286、-0.308、-0.350、-0.291、0.290
    1.2407、464、588、597、648、671、675、723、792、1013100.285、-0.312、0.290、0.319、-0.310、0.280、-0.287、-0.293、-0.368、0.353
    1.4407、425、464、597、648、671、723、775、792、965、1013110.316、-0.294、-0.335、0.315、-0.308、0.287、-0.307、0.282、-0.372、-0.278、0.283
    1.6387、407、425、464、597、648、671、676、723、775、792、965120.296、0.343、-0.283、-0.343、0.305、-0.300、0.285、0.278、-0.311、0.298、-0.366、-0.278
    1.8387、407、464、597、648、671、676、723、775、792、797110.309、0.364、-0.347、0.288、-0.291、0.278、0.289、-0.307、0.309、-0.353、0.277
    2387、407、464、648、676、723、775、792、79790.303、0.377、-0.349、-0.282、0.293、-0.297、0.314、-0.336、0.278
    Table 2. Characteristic bands of SOM under fractional differentiation
    ModelSample typeModel formulaR2RMSERPD
    SVR1Calibration sety=0.76x+2.85830.832.292.43
    SVR1.2y=0.7074x+3.59830.732.841.96
    SVR1.4y=0.6341x+4.79630.673.191.74
    SVR1.6y=0.7051x+3.95630.713.011.85
    SVR1.8y=0.7537x+2.7770.812.452.27
    SVR2y=0.7488x+2.57890.812.484.97
    SVR1Validation sety=0.777x+3.00560.821.753.38
    SVR1.2y=0.8659x+1.96670.931.135.21
    SVR1.4y=0.897x+1.45250.970.797.52
    SVR1.6y=0.9153x+1.2740.970.767.75
    SVR1.8y=0.9031x+1.54410.960.866.83
    SVR2y=0.8639x+2.25840.931.193.73
    PLSR1Calibration sety=0.5492x+5.30370.554.241.31
    PLSR1.2y=0.4062x+6.98540.414.241.30
    PLSR1.4y=0.3676x+7.43940.374.371.27
    PLSR1.6y=0.3553x+7.58380.364.421.26
    PLSR1.8y=0.3697x+7.4150.374.371.27
    PLSR2y=0.3697x+7.41530.374.371.05
    PLSR1Validation sety=0.6591x+4.21270.712.182.71
    PLSR1.2y=0.7094x+3.59080.713.121.86
    PLSR1.4y=0.6275x+4.60230.632.472.39
    PLSR1.6y=0.65x+4.32440.652.392.47
    PLSR1.8y=0.6028x+4.90780.602.552.32
    PLSR2y=0.6137x+4.77390.612.522.09
    RF1

    Calibration set

    y=0.6285x+4.31530.822.612.13
    RF1.2y=0.5551x+5.25840.922.602.14
    RF1.4y=0.5674x+5.11310.912.582.16
    RF1.6y=0.5544x+5.26860.882.702.06
    RF1.8y=0.5864x+4.94690.912.502.22
    RF2y=0.6319x+4.71150.802.712.05
    RF1Validation sety=0.5873x+5.03450.792.072.85
    RF1.2y=0.6418x+4.40540.931.623.65
    RF1.4y=0.604x+4.9530.921.773.34
    RF1.6y=0.5824x+5.25980.901.873.16
    RF1.8y=0.5654x+5.46470.901.933.07
    RF2y=0.6048x+4.6390.861.883.14
    Table 3. SOM content modeling and validation results
    Wuyao Li, Mamat Sawut, Maihemuti Balati. Fractional Differential-Based Hyperspectral Inversion of Soil Organic Matter Content[J]. Laser & Optoelectronics Progress, 2023, 60(7): 0730005
    Download Citation