• Opto-Electronic Science
  • Vol. 1, Issue 7, 220007 (2022)
Shuoqing Liu*, Shizhen Chen*, Shuangchun Wen*, and Hailu Luo*
Author Affiliations
  • Laboratory for Spin Photonics, School of Physics and Electronics, Hunan University, Changsha 410082, China
  • show less
    DOI: 10.29026/oes.2022.220007 Cite this Article
    Shuoqing Liu, Shizhen Chen, Shuangchun Wen, Hailu Luo. Photonic spin Hall effect: fundamentals and emergent applications[J]. Opto-Electronic Science, 2022, 1(7): 220007 Copy Citation Text show less
    The spin angular momentum (SAM) and the orbit angular momentum (OAM) of paraxial beams. The transient electric field vector of circularly polarized beam brings the SAM of (a) S=+ℏ and (b)S=−ℏ; the intrinsic OAM in a vortex beam with topological charges of (c) l = +1 and (d) l = −1; the extrinsic OAM occurs in x-direction when the beam undergoes a (e) positive or (f) negative shift in y-direction.
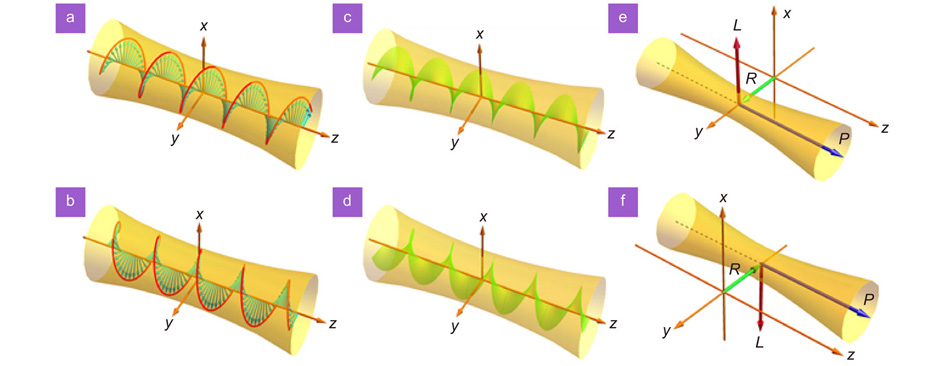
    Fig. 1. The spin angular momentum (SAM) and the orbit angular momentum (OAM) of paraxial beams. The transient electric field vector of circularly polarized beam brings the SAM of (a) S=+ and (b) S=; the intrinsic OAM in a vortex beam with topological charges of (c) l = +1 and (d) l = −1; the extrinsic OAM occurs in x-direction when the beam undergoes a (e) positive or (f) negative shift in y-direction.
    Geometric phases and their generation in three-dimensional curved space. (a) The non-trivial parallel transports of wave vector appear in the three-dimensional momentum space to provide geometric phases. (b) Propagation of the fiber axis along a curvilinear trajectory. (c) The non-trivial parallel transport of Stokes vector in three-dimensional Stokes space. (d) The geometric phase gradient is acquired when the circularly polarized beam passes through a nonuniform birefringence wave plate with a locally varying optical axis.
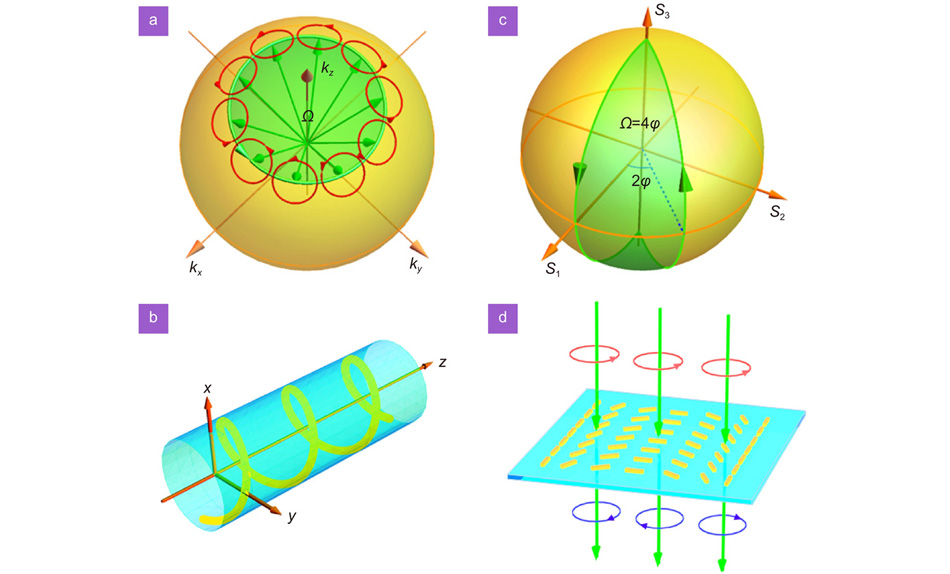
    Fig. 2. Geometric phases and their generation in three-dimensional curved space. (a) The non-trivial parallel transports of wave vector appear in the three-dimensional momentum space to provide geometric phases. (b) Propagation of the fiber axis along a curvilinear trajectory. (c) The non-trivial parallel transport of Stokes vector in three-dimensional Stokes space. (d) The geometric phase gradient is acquired when the circularly polarized beam passes through a nonuniform birefringence wave plate with a locally varying optical axis.
    Photonic SHE induced by the spin-redirection RVB phase at an optical interface. (a) The linearly polarized beam splits into the RCP and the LCP components after reflecting from an optical interface, manifested as the spin-dependent splitting. (b) The beam reflection can be regarded as the parallel transport of wave vectors in the momentum space, resulting in the polarization rotation.
    Fig. 3. Photonic SHE induced by the spin-redirection RVB phase at an optical interface. (a) The linearly polarized beam splits into the RCP and the LCP components after reflecting from an optical interface, manifested as the spin-dependent splitting. (b) The beam reflection can be regarded as the parallel transport of wave vectors in the momentum space, resulting in the polarization rotation.
    Schematic and experimental illustration of photonic SHE induced by the PB phase in a metasurface. (a) The conservation of the spin states as a circularly polarized beam passes through a structured metasurface with a spin-dependent PB phase gradient ∇ΦG. The green arrows through the metasurface and the varying short lines marked on the metasurface represent the wave vectors and the local optical axis orientation, respectively. For incidence of right-circularly polarized (RCP, indicated by σ+ in red) light or left-circularly polarized (LCP, indicated by σ– in blue) light, the metasurface produces the opposite∇ΦG and acquires the opposite spin-dependent momentum shifts. The corresponding polarization evolution is presented on the Poincaré sphere, where the trajectories (A, B) and (C, D) represent the initial spin states conservation in metamaterials with different local optical axes. (b) Detailed photograph and geometry of the metasurface with local optical axis (slow axis) over one period (20 mm). In such a metasurface, the mapping relationship between the momentum shift Δk and the induced real-space shift Δx is given. After the linearly polarized beam passes through the metasurface with rotation rate Ω = π/20 rad μm−1, the calculated (Cal.) and experimental (Exp.) results of spin-dependent real-space shift can be obtained in (c), and a charge-coupled device records the light intensity and the corresponding S3 parameter in (d). Figure reproduced with permission from ref.89, under a Creative Commons Attribution-NonCommercial-NoDerivs 3.0 Unported License.
    Fig. 4. Schematic and experimental illustration of photonic SHE induced by the PB phase in a metasurface. (a) The conservation of the spin states as a circularly polarized beam passes through a structured metasurface with a spin-dependent PB phase gradient ΦG. The green arrows through the metasurface and the varying short lines marked on the metasurface represent the wave vectors and the local optical axis orientation, respectively. For incidence of right-circularly polarized (RCP, indicated by σ+ in red) light or left-circularly polarized (LCP, indicated by σ in blue) light, the metasurface produces the opposite ΦG and acquires the opposite spin-dependent momentum shifts. The corresponding polarization evolution is presented on the Poincaré sphere, where the trajectories (A, B) and (C, D) represent the initial spin states conservation in metamaterials with different local optical axes. (b) Detailed photograph and geometry of the metasurface with local optical axis (slow axis) over one period (20 mm). In such a metasurface, the mapping relationship between the momentum shift Δk and the induced real-space shift Δx is given. After the linearly polarized beam passes through the metasurface with rotation rate Ω = π/20 rad μm−1, the calculated (Cal.) and experimental (Exp.) results of spin-dependent real-space shift can be obtained in (c), and a charge-coupled device records the light intensity and the corresponding S3 parameter in (d). Figure reproduced with permission from ref.89, under a Creative Commons Attribution-NonCommercial-NoDerivs 3.0 Unported License.
    Weak measurements of photonic SHE after beam refraction at an air-glass interface. (a) The RCP and LCP components of a wave packet experience opposite transverse shifts after refraction on an air-glass interface. (b) Experimental setup for observing and amplifying the photonic SHE with incident wavelength of 633 nm. Three main steps in weak measurements should be considered: pre-selection, weak interaction and post-selection. The incident beam passes through HWP, L1 and P1 to obtain the pre-selected state |H〉 or|V〉, and then the|H〉 or|V〉 beam reaches the VAP to provide the weak interaction. Subsequently, the RCP and LCP components of the refracted beam acquire the post-selected state by P2 and then be recorded by PS after L2. (c) Experimental results for the amplified shifts |δH| and |δV| as functions of incidence angle θI for|H〉 and|V〉 input polarizations. P1 and P2, Glan laser polarizers; L1 and L2, lenses with effective focal lengths 25 mm and 125 mm correspondingly; VAP, made of BK7 glass with refractive index n = 1.515 at wavelength λ = 633 nm; HWP, half-wave plate for modulating the light intensity; PS, position sensor. Figure reproduced with permission from: (a) ref.141, Science; (b, c) ref.45, AAAS.
    Fig. 5. Weak measurements of photonic SHE after beam refraction at an air-glass interface. (a) The RCP and LCP components of a wave packet experience opposite transverse shifts after refraction on an air-glass interface. (b) Experimental setup for observing and amplifying the photonic SHE with incident wavelength of 633 nm. Three main steps in weak measurements should be considered: pre-selection, weak interaction and post-selection. The incident beam passes through HWP, L1 and P1 to obtain the pre-selected state |H or |V, and then the |H or |V beam reaches the VAP to provide the weak interaction. Subsequently, the RCP and LCP components of the refracted beam acquire the post-selected state by P2 and then be recorded by PS after L2. (c) Experimental results for the amplified shifts |δH| and |δV| as functions of incidence angle θI for |H and |V input polarizations. P1 and P2, Glan laser polarizers; L1 and L2, lenses with effective focal lengths 25 mm and 125 mm correspondingly; VAP, made of BK7 glass with refractive index n = 1.515 at wavelength λ = 633 nm; HWP, half-wave plate for modulating the light intensity; PS, position sensor. Figure reproduced with permission from: (a) ref.141, Science; (b, c) ref.45, AAAS.
    Weak measurements of polarization rotation rate after total internal reflection at optical interface. (a) Experimental setup. A polarized Gaussian beam yielded by the He-Ne Laser strikes on the prism-air interface with the tiny rotation of polarization state, and therefore induces a geometric phase gradient in momentum space. This also appears as the initial spin Hall shift, which can be magnified efficiently after the whole weak measurements process. The lenses (L1 and L2) focus and collimate the light; the 1/4 wave plate (QWP) cooperated with the Glan laser polarizers (GLP1 and GLP2) selects the pre- and the post-selected states, which can be presented on a Poincaré sphere with α and β representing the pre- and post-selected angles correspondingly; 1/2 wave plate (HWP) is used to adjust the light intensity; the CCD camera captures the intensity profiles. (b) The amplified spatial shifts as function of β. (c) The initial spatial shift in position space. Figure reproduced with permission from ref.115, Optica, under the Optica Open Access Publishing Agreement.
    Fig. 6. Weak measurements of polarization rotation rate after total internal reflection at optical interface. (a) Experimental setup. A polarized Gaussian beam yielded by the He-Ne Laser strikes on the prism-air interface with the tiny rotation of polarization state, and therefore induces a geometric phase gradient in momentum space. This also appears as the initial spin Hall shift, which can be magnified efficiently after the whole weak measurements process. The lenses (L1 and L2) focus and collimate the light; the 1/4 wave plate (QWP) cooperated with the Glan laser polarizers (GLP1 and GLP2) selects the pre- and the post-selected states, which can be presented on a Poincaré sphere with α and β representing the pre- and post-selected angles correspondingly; 1/2 wave plate (HWP) is used to adjust the light intensity; the CCD camera captures the intensity profiles. (b) The amplified spatial shifts as function of β. (c) The initial spatial shift in position space. Figure reproduced with permission from ref.115, Optica, under the Optica Open Access Publishing Agreement.
    Weak measurements of photonic SHE with a dielectric metasurface possessing PB phase gradient. (a) The photonic metasurface version for experiments on weak measurements. The Glan laser polarizer (GLP1) pre-selects the initial state of the photons emitted by the Laser; the dielectric metasurface (MS) generates a small space-variant phase (i.e., the PB phase) and acts as the weak magnetic field; The combination of the 1/4 wave plate (QWP) and the second polarizer (GLP2) post-selects the final state. (b) The MS is designed with homogeneous phase redirection π, whose optical axis orientation varies periodically only on the x direction with the period d. (c) Amplified shifts as functions of post-selected angle β with purely imaginary weak value. The theoretical predictions with three different transmission distances are presented as the same (black curve), and the experimental data (hollow points) satisfies the predictions. The inset illustrates the initial and final states on the Poincaré sphere. Figure reproduced with permission from ref.146, AIP Publishing.
    Fig. 7. Weak measurements of photonic SHE with a dielectric metasurface possessing PB phase gradient. (a) The photonic metasurface version for experiments on weak measurements. The Glan laser polarizer (GLP1) pre-selects the initial state of the photons emitted by the Laser; the dielectric metasurface (MS) generates a small space-variant phase (i.e., the PB phase) and acts as the weak magnetic field; The combination of the 1/4 wave plate (QWP) and the second polarizer (GLP2) post-selects the final state. (b) The MS is designed with homogeneous phase redirection π, whose optical axis orientation varies periodically only on the x direction with the period d. (c) Amplified shifts as functions of post-selected angle β with purely imaginary weak value. The theoretical predictions with three different transmission distances are presented as the same (black curve), and the experimental data (hollow points) satisfies the predictions. The inset illustrates the initial and final states on the Poincaré sphere. Figure reproduced with permission from ref.146, AIP Publishing.
    Application examples of precision measurement on nanometal film parameters using photonic SHE. (a) Schematic and the experimental results of measuring the thickness of an Ag film with weak measurements. Left: A linearly polarized beam reflects on the air-Ag film-BK7 glass system at an angle θi and then splits into RCP and LCP components with transverse shifts of δ+ and δ–, respectively. Middle: the experimental setup for weak measurements of photonic SHE after beam reflection at Ag sample. Right: experimentally measured amplified spin Hall shifts as functions of incident angle at different thicknesses (12 nm and 30 nm) of Ag films. (b) Schematic and the experimental results of measuring the magneto-optical constant of Fe films with weak measurements. Left: the experimental setup for weak measurements of spin Hall shifts after beam reflection at sample Fe films (thickness of 450 nm), where the electromagnet (EM) and the magnetic field applied on the magnetic film perpendicularly. Middle: The amplitude (squares) and phase factor (circles) of the magneto-optical constant Q in the sample fit well with the experimental data, where the dotted lines are the fitting lines. Right: The light intensities for |H〉 and|V〉 polarizations change with the magnetic intensity. P: Polarizers; L: Lenses; HWP: 1/2 wave plate. Figure reproduced with permission from: (a) ref.111, American Physical Society; (b) ref.154, AIP Publishing.
    Fig. 8. Application examples of precision measurement on nanometal film parameters using photonic SHE. (a) Schematic and the experimental results of measuring the thickness of an Ag film with weak measurements. Left: A linearly polarized beam reflects on the air-Ag film-BK7 glass system at an angle θi and then splits into RCP and LCP components with transverse shifts of δ+ and δ, respectively. Middle: the experimental setup for weak measurements of photonic SHE after beam reflection at Ag sample. Right: experimentally measured amplified spin Hall shifts as functions of incident angle at different thicknesses (12 nm and 30 nm) of Ag films. (b) Schematic and the experimental results of measuring the magneto-optical constant of Fe films with weak measurements. Left: the experimental setup for weak measurements of spin Hall shifts after beam reflection at sample Fe films (thickness of 450 nm), where the electromagnet (EM) and the magnetic field applied on the magnetic film perpendicularly. Middle: The amplitude (squares) and phase factor (circles) of the magneto-optical constant Q in the sample fit well with the experimental data, where the dotted lines are the fitting lines. Right: The light intensities for |H and |V polarizations change with the magnetic intensity. P: Polarizers; L: Lenses; HWP: 1/2 wave plate. Figure reproduced with permission from: (a) ref.111, American Physical Society; (b) ref.154, AIP Publishing.
    Application examples of accurate determination on 2D atomic crystal parameters using photonic SHE. (a) Schematic and the experimental results of determining the conductivity of graphene with weak measurements. Left: the experimental setup for weak measurements of photonic SHE after beam reflection in graphene. Middle: the amplified spin Hall shifts in monolayer graphene as functions of post-selected angle β. Theoretical results for optical conductivity taken as 0.67σ0, 0.90σ0, 1.1σ0, and 1.33σ0, and the fitting curves are obtained on the basis of three groups of data (in unit of σ0). The result without graphene (in red) is also given for comparison. Right: Measurement of the optical conductivity for monolayer, bilayer, and trilayer graphene, where the horizontal green lines correspond to the values 0.90σ0, and 1.1σ0. (b) Schematic of two optical models of graphene and its examination. Left: the geometry of a planewave incident on graphene at an angle θi for the zero-thickness model and the slab model, where the insets illustrate the beam propagation through side views of the models. Right: Measurements of the spin Hall shifts for monolayer, bilayer, trilayer, fivelayer, and without graphene (red, blue, green, orange, and black curves) as functions of the incident angle. The corresponding theoretical predictions based on different models are also shown: the solid curves, the zero-thickness model; the dash dotted curves and the dashed curves, the slab model with refractive indices 2.6 + 1.3i and 3.0 + 1.149i, respectively. Figure reproduced with permission from: (a) ref. 118, American Physical Society; (a, b) ref.121, The Optical Society.
    Fig. 9. Application examples of accurate determination on 2D atomic crystal parameters using photonic SHE. (a) Schematic and the experimental results of determining the conductivity of graphene with weak measurements. Left: the experimental setup for weak measurements of photonic SHE after beam reflection in graphene. Middle: the amplified spin Hall shifts in monolayer graphene as functions of post-selected angle β. Theoretical results for optical conductivity taken as 0.67σ0, 0.90σ0, 1.1σ0, and 1.33σ0, and the fitting curves are obtained on the basis of three groups of data (in unit of σ0). The result without graphene (in red) is also given for comparison. Right: Measurement of the optical conductivity for monolayer, bilayer, and trilayer graphene, where the horizontal green lines correspond to the values 0.90σ0, and 1.1σ0. (b) Schematic of two optical models of graphene and its examination. Left: the geometry of a planewave incident on graphene at an angle θi for the zero-thickness model and the slab model, where the insets illustrate the beam propagation through side views of the models. Right: Measurements of the spin Hall shifts for monolayer, bilayer, trilayer, fivelayer, and without graphene (red, blue, green, orange, and black curves) as functions of the incident angle. The corresponding theoretical predictions based on different models are also shown: the solid curves, the zero-thickness model; the dash dotted curves and the dashed curves, the slab model with refractive indices 2.6 + 1.3i and 3.0 + 1.149i, respectively. Figure reproduced with permission from: (a) ref. 118, American Physical Society; (a, b) ref.121, The Optical Society.
    Application examples of chemical solution detection and biosensing using photonic SHE. (a) Schematic and the experimental results of detecting the ion concentration in solution with weak measurements. Left: the experimental setup for ion concentration detection. HWP, 1/2 wave plate; GLP1 and GLP2, the Glan laser polarizers to obtain the pre- and post-selected states (represented on a Poincaré sphere in the inset). An external magnetic field is applied in such a weak measurement system, and the polarization plane will rotate (Faraday rotation) with a small angle Δ after the beam crossing the magneto-optical media, as shown in the top middle. Bottom middle: the dependence of amplified spin Hall shifts on Δ without the external magnetic field, where the insets show the corresponding intensity distributions. Right: the experimental detection result of ion concentration of three samples NaCl, MgCl2 and CaCl2 based on the amplified spin-Hall shifts. (b) Schematic and the experimental results of monitoring sucrose hydrolysis rates with weak measurements. Top left: schematic to illustrate the process of sucrose hydrolysis. Bottom left: the optical activity of chiral molecules. The polarization plane of a linearly polarized beam will rotate at an angle α1(α2) after passing through glucose and fructose. Middle: experimental system of weak measurements similar to that in (a) by replacing the sample and external magnetic field with CS (sucrose). The insets illustrate the variation of polarization states in weak measurements. Right: the amplified pointer shifts as functions of time (sucrose hydrolysis rates) for different concentrations of acid. Figure reproduced with permission from: (a) ref.160, AIP Publishing; (b) ref.161, under a Creative Commons Attribution (CC BY) license.
    Fig. 10. Application examples of chemical solution detection and biosensing using photonic SHE. (a) Schematic and the experimental results of detecting the ion concentration in solution with weak measurements. Left: the experimental setup for ion concentration detection. HWP, 1/2 wave plate; GLP1 and GLP2, the Glan laser polarizers to obtain the pre- and post-selected states (represented on a Poincaré sphere in the inset). An external magnetic field is applied in such a weak measurement system, and the polarization plane will rotate (Faraday rotation) with a small angle Δ after the beam crossing the magneto-optical media, as shown in the top middle. Bottom middle: the dependence of amplified spin Hall shifts on Δ without the external magnetic field, where the insets show the corresponding intensity distributions. Right: the experimental detection result of ion concentration of three samples NaCl, MgCl2 and CaCl2 based on the amplified spin-Hall shifts. (b) Schematic and the experimental results of monitoring sucrose hydrolysis rates with weak measurements. Top left: schematic to illustrate the process of sucrose hydrolysis. Bottom left: the optical activity of chiral molecules. The polarization plane of a linearly polarized beam will rotate at an angle α1(α2) after passing through glucose and fructose. Middle: experimental system of weak measurements similar to that in (a) by replacing the sample and external magnetic field with CS (sucrose). The insets illustrate the variation of polarization states in weak measurements. Right: the amplified pointer shifts as functions of time (sucrose hydrolysis rates) for different concentrations of acid. Figure reproduced with permission from: (a) ref.160, AIP Publishing; (b) ref.161, under a Creative Commons Attribution (CC BY) license.
    Spatial differentiation and image edge detection based on photonic SHE of beam reflection. The spatial differentiation is constituted mainly by the photonic SHE at the optical reflection interface and two polarizers. The beam is reflected on an optical planar interface between two isotropic materials to obtain the spin-dependent splitting. The two polarizers (dark gray) are oriented at the angles indicated with double-head arrows: (a) preparing along x and analyzing along y and (b) vice versa. (c) and (d) are the corresponding edge detection for different images stored in Exin andEyin, with either amplitude or phase modulation. Figure reproduced with permission from ref.170, under a Creative Commons Attribution 4.0 International License.
    Fig. 11. Spatial differentiation and image edge detection based on photonic SHE of beam reflection. The spatial differentiation is constituted mainly by the photonic SHE at the optical reflection interface and two polarizers. The beam is reflected on an optical planar interface between two isotropic materials to obtain the spin-dependent splitting. The two polarizers (dark gray) are oriented at the angles indicated with double-head arrows: (a) preparing along x and analyzing along y and (b) vice versa. (c) and (d) are the corresponding edge detection for different images stored in Exin and Eyin, with either amplitude or phase modulation. Figure reproduced with permission from ref.170, under a Creative Commons Attribution 4.0 International License.
    Optical full differentiator and image edge detection based on photonic SHE at an optical interface. (a) Schematic of the optical full differentiator. The double-head arrows represent the polarization axis of two applied polarizers, which fed a complete “SPIN” image and outputs its edge image. (b) Experimental setup for image edge detection based on the optical full differentiator. The 4f system is critically introduced by lenses (L): L1 and L2 form the first 4f system; L3 and L4 constitute the second 4f system; the object is stored at the front focal plane of L1, the optical path between L2 and L3 equals the sum of their focal lengths, and the CCD is placed at the rear focal plane of L4. The inset presents the USAF-1951 resolution target (object). Under such a setup, the edge images can be obtained at both the wavelength of (c) 632.8 nm and (d) 532 nm. The first row shows the complete and edge images of number 2, the second row indicates the images of letter S, and the third row denotes that of horizontal stripes. The white double-headed arrows represent the polarization angle of the incident beam as 0°, 10° and 40°. Figure reproduced with permssion from ref.175, under a Creative Commons Attribution 4.0 International License.
    Fig. 12. Optical full differentiator and image edge detection based on photonic SHE at an optical interface. (a) Schematic of the optical full differentiator. The double-head arrows represent the polarization axis of two applied polarizers, which fed a complete “SPIN” image and outputs its edge image. (b) Experimental setup for image edge detection based on the optical full differentiator. The 4f system is critically introduced by lenses (L): L1 and L2 form the first 4f system; L3 and L4 constitute the second 4f system; the object is stored at the front focal plane of L1, the optical path between L2 and L3 equals the sum of their focal lengths, and the CCD is placed at the rear focal plane of L4. The inset presents the USAF-1951 resolution target (object). Under such a setup, the edge images can be obtained at both the wavelength of (c) 632.8 nm and (d) 532 nm. The first row shows the complete and edge images of number 2, the second row indicates the images of letter S, and the third row denotes that of horizontal stripes. The white double-headed arrows represent the polarization angle of the incident beam as 0°, 10° and 40°. Figure reproduced with permssion from ref.175, under a Creative Commons Attribution 4.0 International License.
    Broadband edge detection based on photonic SHE in high-efficiency PB phase metasurfaces. (a) Experimental setup: two lenses form a 4f system, and the metasurface (sample) is sandwiched by two polarizers (P1 and P2). L1 and L2: a pair of lenses. (b) Top: photograph of the metasurface embedded in glass with its optical axis orientation in one period indicated by red bars. Bottom: the RCP and LCP photons acquire the opposite external orbit angular momentum after the interaction with the metasurface, manifesting as the RCP and the LCP images with a slight shift at the image plane. (c) Broadband edge-detection demonstration. The first row shows the images without the analyzer, and the second row are the edge image after the crossed polarizers. The metasurface period here is 8000 μm, and the illumination wavelengths are 430 nm, 500 nm, and 670 nm, respectively. (d) Various results of edge detection with different phase gradient periods of 500 μm, 750 μm, 1000 μm, and 8000 μm. The first row is photographs of different metasurface samples; the second row indicates polarized images of the samples (scale bar, 125 μm); the third row shows two separated RCP and LCP images without the analyzer; the fourth row gives edge images corresponding to different resolutions. The wavelength is fixed as 500 nm. Figure reproduced from: ref.171, under a Creative Commons Attribution-Noncommercial-NoDerivatives License 4.0.
    Fig. 13. Broadband edge detection based on photonic SHE in high-efficiency PB phase metasurfaces. (a) Experimental setup: two lenses form a 4f system, and the metasurface (sample) is sandwiched by two polarizers (P1 and P2). L1 and L2: a pair of lenses. (b) Top: photograph of the metasurface embedded in glass with its optical axis orientation in one period indicated by red bars. Bottom: the RCP and LCP photons acquire the opposite external orbit angular momentum after the interaction with the metasurface, manifesting as the RCP and the LCP images with a slight shift at the image plane. (c) Broadband edge-detection demonstration. The first row shows the images without the analyzer, and the second row are the edge image after the crossed polarizers. The metasurface period here is 8000 μm, and the illumination wavelengths are 430 nm, 500 nm, and 670 nm, respectively. (d) Various results of edge detection with different phase gradient periods of 500 μm, 750 μm, 1000 μm, and 8000 μm. The first row is photographs of different metasurface samples; the second row indicates polarized images of the samples (scale bar, 125 μm); the third row shows two separated RCP and LCP images without the analyzer; the fourth row gives edge images corresponding to different resolutions. The wavelength is fixed as 500 nm. Figure reproduced from: ref.171, under a Creative Commons Attribution-Noncommercial-NoDerivatives License 4.0.
    Broadband 2D spatial differentiator and high-contrast edge detection of phase objects based on PB phase metasurfaces. (a) The phase metasurface sample. Left: photograph of a metasurface embedded in silica glass; Middle: zoomed polariscope image of the sample pattern area and its finer structure, where the inset represents the top view of scanning electron microscope (SEM); Right: the slow axis orientation of the sample in pseudo color. (b) Setup of the spatial differentiator and its measurements of the spatial transfer function. Left: the experimental setup, where the phase metasurface is sandwiched by two orthogonal polarizers; Middle: the experimental results without and with the spatial differentiator correspondingly. Right: both the theoretical and the experimental outputs of the transfer function. (c) Micro-scale imaging schemes of bright field, phase contrast, dark field, and edge detection. The first row denotes the detected human umbilical vein endothelial cell, and the second row shows the observed human bronchial epithelial cell. (d) Experimental setup for the edge detection of a phase object. The output laser, coupled to the measurement system by a fiber coupler, expands to provide uniform illumination for the field view of the microscope by using a condenser. The cell sample and the metasurface sample are respectively placed in front or at back focal plane of the objective. Figure reproduced with permission from ref.182, under a Creative Commons Attribution License.
    Fig. 14. Broadband 2D spatial differentiator and high-contrast edge detection of phase objects based on PB phase metasurfaces. (a) The phase metasurface sample. Left: photograph of a metasurface embedded in silica glass; Middle: zoomed polariscope image of the sample pattern area and its finer structure, where the inset represents the top view of scanning electron microscope (SEM); Right: the slow axis orientation of the sample in pseudo color. (b) Setup of the spatial differentiator and its measurements of the spatial transfer function. Left: the experimental setup, where the phase metasurface is sandwiched by two orthogonal polarizers; Middle: the experimental results without and with the spatial differentiator correspondingly. Right: both the theoretical and the experimental outputs of the transfer function. (c) Micro-scale imaging schemes of bright field, phase contrast, dark field, and edge detection. The first row denotes the detected human umbilical vein endothelial cell, and the second row shows the observed human bronchial epithelial cell. (d) Experimental setup for the edge detection of a phase object. The output laser, coupled to the measurement system by a fiber coupler, expands to provide uniform illumination for the field view of the microscope by using a condenser. The cell sample and the metasurface sample are respectively placed in front or at back focal plane of the objective. Figure reproduced with permission from ref.182, under a Creative Commons Attribution License.
    Quantum switchable edge detection based on photonic SHE in PB phase metasurfaces. (a) Experimental setup for metasurface enabled quantum edge detection. BDM, broadband dielectric mirror; PPKTP crystal, periodically polarized KTiOPO4 crystal; DHWP, dual-wavelength 1/2 wave plate; DPBS, dual-wavelength polarization beam splitter; DM, dichroic mirror; SPAD, single photon avalanche detector; PBS, polarization beam splitter; FC, fiber coupler; BPF, band-pass filter; ICCD, intensified charge coupled device. The entangled photon source is in wavelength of 405 nm (810 nm) light for the blue (red) light path. The edge detection switch runs on the forecast end, and the edge detection system is placed on the imaging end. (b) Top: the illustration of coincidence measurement, where the question mark “?” implies unknown polarization state in the trigger arm, and the image would be a superposition of the “solid cat” and the “outlined cat” if the Schrodinger cat is illuminated by unknown linear polarized photons from the polarized entangled source. Bottom: the schematic of controlling the image detection via polarization switch, where polarization |H〉 brings out OFF state, resulting in the bright field mode “solid cat” (the first row indicates simulation and experimental imaging);|V〉 indicates ON state, resulting in edge detection mode “outlined cat” (the second row shows simulation and experimental imaging). (c) The edge detection images are triggered by the heralding detector, which exhibits a high signal-to-noise ratio. Figure reproduced with permission from ref.187, under a Creative Commons Attribution 4.0 International License.
    Fig. 15. Quantum switchable edge detection based on photonic SHE in PB phase metasurfaces. (a) Experimental setup for metasurface enabled quantum edge detection. BDM, broadband dielectric mirror; PPKTP crystal, periodically polarized KTiOPO4 crystal; DHWP, dual-wavelength 1/2 wave plate; DPBS, dual-wavelength polarization beam splitter; DM, dichroic mirror; SPAD, single photon avalanche detector; PBS, polarization beam splitter; FC, fiber coupler; BPF, band-pass filter; ICCD, intensified charge coupled device. The entangled photon source is in wavelength of 405 nm (810 nm) light for the blue (red) light path. The edge detection switch runs on the forecast end, and the edge detection system is placed on the imaging end. (b) Top: the illustration of coincidence measurement, where the question mark “?” implies unknown polarization state in the trigger arm, and the image would be a superposition of the “solid cat” and the “outlined cat” if the Schrodinger cat is illuminated by unknown linear polarized photons from the polarized entangled source. Bottom: the schematic of controlling the image detection via polarization switch, where polarization |H brings out OFF state, resulting in the bright field mode “solid cat” (the first row indicates simulation and experimental imaging); |V indicates ON state, resulting in edge detection mode “outlined cat” (the second row shows simulation and experimental imaging). (c) The edge detection images are triggered by the heralding detector, which exhibits a high signal-to-noise ratio. Figure reproduced with permission from ref.187, under a Creative Commons Attribution 4.0 International License.
    Shuoqing Liu, Shizhen Chen, Shuangchun Wen, Hailu Luo. Photonic spin Hall effect: fundamentals and emergent applications[J]. Opto-Electronic Science, 2022, 1(7): 220007
    Download Citation