• Spectroscopy and Spectral Analysis
  • Vol. 42, Issue 6, 1915 (2022)
Fang MA1、1;, An-min HUANG2、2;, and Qiu-hui ZHANG1、1; *;
Author Affiliations
  • 11. MOE Key Laboratory of Wooden Material Science and Application, Beijing Forestry University, Beijing 100083, China
  • 22. Research Institute of Wood Industry, Chinese Academy of Forestry, Beijing 100091, China
  • show less
    DOI: 10.3964/j.issn.1000-0593(2022)06-1915-07 Cite this Article
    Fang MA, An-min HUANG, Qiu-hui ZHANG. Discrimination of Four Black Heartwoods Using FTIR Spectroscopy and Clustering Analysis[J]. Spectroscopy and Spectral Analysis, 2022, 42(6): 1915 Copy Citation Text show less
    Four types of heartwood samples(a): D. ebenum; (b): D. melanoxylon; (c): C. imberbe; (d): G. conjugate
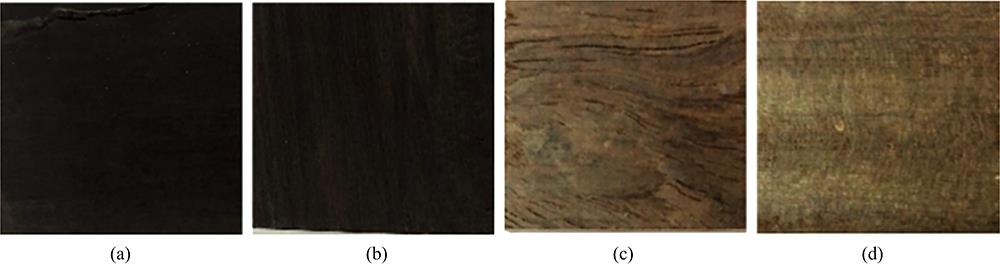
    Fig. 1. Four types of heartwood samples
    (a): D. ebenum; (b): D. melanoxylon; (c): C. imberbe; (d): G. conjugate
    FTIR spectra of experimental samplesa: D. ebenum; b: D. melanoxylon; c: C. imberbe; d: G. conjugate
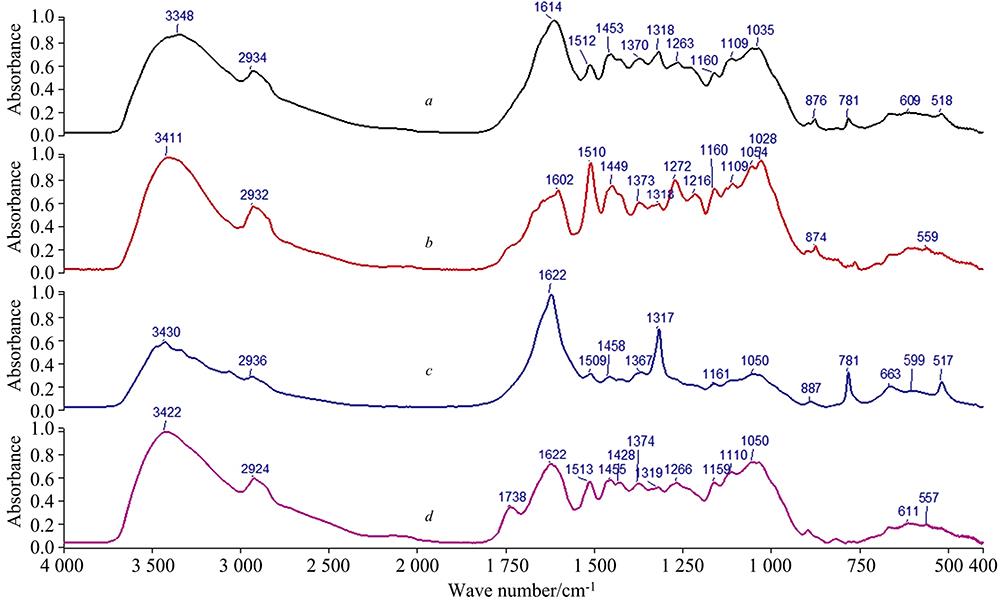
    Fig. 2. FTIR spectra of experimental samples
    a: D. ebenum; b: D. melanoxylon; c: C. imberbe; d: G. conjugate
    FTIR spectra of Cellulose, Lignin and Calcium oxalate
    Fig. 3. FTIR spectra of Cellulose, Lignin and Calcium oxalate
    The distances of D. ebenum (a), D. melanoxylon (b), C. imberbe (c) and G. conjugate (d)
    Fig. 4. The distances of D. ebenum (a), D. melanoxylon (b), C. imberbe (c) and G. conjugate (d)
    2DCOS-IR spectra and auto-peaks of D. ebenum (a), D. melanoxylon (b), C. imberbe (c) and G. conjugate (d)
    Fig. 5. 2DCOS-IR spectra and auto-peaks of D. ebenum (a), D. melanoxylon (b), C. imberbe (c) and G. conjugate (d)
    D. ebenumD. melanoxylonC. imberbeG. conjugata
    H1 059H1 510H781H1 059H1 510H781H1 059H1 510H781H1 059H1 510H781
    10.980 60.508 50.067 70.815 90.983 00.054 70.652 20.584 80.546 70.896 10.676 10.048 4
    21.078 00.552 40.068 50.782 80.964 10.049 70.659 00.561 80.466 70.910 60.678 80.075 6
    31.130 10.573 80.065 90.863 80.908 00.028 30.708 20.561 60.513 10.975 80.712 70.063 1
    41.185 70.605 10.073 80.848 20.970 50.064 50.613 30.568 40.560 91.026 90.740 30.063 4
    50.877 60.707 00.152 10.845 11.006 80.065 60.625 80.642 50.497 80.885 40.639 60.024 9
    60.946 00.757 00.150 40.792 71.029 30.089 60.665 00.667 30.500 60.903 70.613 20.061 4
    70.989 90.792 40.143 20.804 50.899 10.045 70.700 50.696 00.519 20.963 20.668 50.015 7
    81.093 80.855 80.138 00.861 90.933 80.049 60.709 60.571 20.407 40.926 90.678 40.059 1
    90.819 30.551 60.070 90.891 20.991 10.027 70.609 00.584 40.521 30.930 80.638 70.063 5
    100.842 50.560 10.067 10.928 11.023 10.032 60.610 00.523 70.539 40.958 80.639 90.062 2
    110.872 00.570 00.064 70.968 10.821 60.085 60.509 70.511 50.535 20.709 00.537 40.006 3
    120.956 70.612 70.064 50.775 11.180 40.081 20.541 80.536 70.562 20.894 60.661 50.002 3
    130.999 50.635 10.063 30.860 90.834 60.044 20.565 50.580 80.594 30.578 10.445 50.000 9
    140.914 90.489 00.136 20.816 70.937 40.070 40.643 90.564 90.507 60.820 80.636 70.085 3
    150.951 00.495 00.076 40.799 80.976 90.069 40.642 40.549 30.608 00.908 10.662 10.048 5
    H̅0.975 80.617 70.093 50.843 70.964 00.057 30.630 40.580 30.525 40.885 90.642 00.045 3
    HSTD0.103 70.107 90.036 00.052 80.093 20.019 30.056 50.049 50.047 70.108 00.068 50.027 1
    HRSD0.106 30.174 70.385 30.062 60.086 30.337 80.089 60.085 40.090 90.121 90.106 70.599 7
    Table 1. Relative intensities of the characteristic peaks for 4 types of sample
    MaterialSpecified materialIdentified materialResultCorrelationCorrelation Threshold
    1D. ebenumD. ebenumPassed0.921 30.800 1
    2D. ebenumD. ebenumPassed0.957 50.800 1
    3D. ebenumD. ebenumPassed0.974 60.800 1
    4D. ebenumD. ebenumPassed0.935 90.800 1
    5D. ebenumD. ebenumPassed0.936 30.800 1
    6D. melanoxylonD. melanoxylonPassed0.951 70.866 2
    7D. melanoxylonD. melanoxylonPassed0.986 70.866 2
    8D. melanoxylonD. melanoxylonPassed0.983 30.866 2
    9D. melanoxylonD. melanoxylonPassed0.977 20.866 2
    10D. melanoxylonD. melanoxylonPassed0.972 20.866 2
    11C. imberbeC. imberbePassed0.955 30.814 3
    12C. imberbeC. imberbePassed0.936 90.814 3
    13C. imberbeC. imberbePassed0.910 80.814 3
    14C. imberbeC. imberbePassed0.936 10.814 3
    15C. imberbeC. imberbePassed0.968 40.814 3
    16G. conjugataG. conjugataPassed0.981 70.887 2
    17G. conjugataG. conjugataPassed0.980 20.887 2
    18G. conjugataOtherFailed0.886 70.887 2
    19G. conjugataG. conjugataPassed0.990 00.887 2
    20G. conjugataG. conjugataPassed0.969 10.887 2
    Table 2. The validation result of experimental sample (Compare)
    MaterialD. ebenumD. melanoxylonC. imberbeG. conjugata
    D. ebenum-11.913.77.21
    D. melanoxylon--27.94.72
    C. imberbe---15.8
    Table 3. Inter-class distances of experimental sample (SIMCA)
    MaterialD. ebenumD. melanoxylonC. imberbeG. conjugata
    Recognition rate/%100(10/10)100(10/10)100(10/10)100(10/10)
    Rejection rate/%100(30/30)100(30/30)100(30/30)100(30/30)
    Validation rate/%100(5/5)100(5/5)100(5/5)100(5/5)
    Table 4. Classification performance report of experimental sample (SIMCA)
    Fang MA, An-min HUANG, Qiu-hui ZHANG. Discrimination of Four Black Heartwoods Using FTIR Spectroscopy and Clustering Analysis[J]. Spectroscopy and Spectral Analysis, 2022, 42(6): 1915
    Download Citation