• Journal of Geo-information Science
  • Vol. 22, Issue 6, 1189 (2020)
Boyang GAO1、1, Huilin LUO1、1, Zhiji HUANG2、2、*, Fanya XU1、1, and Baihong LIU3、3
Author Affiliations
  • 1. 中央财经大学管理科学与工程学院,北京 100081
  • 1School of Management Science and Engineering, Central University of Finance and Economics, Beijing 100081, China
  • 2. 中央财经大学政府管理学院,北京 100081
  • 2School of Government, Central University of Finance and Economics, Beijing 100081, China
  • 3. 香港浸会大学社会科学院,香港 999077
  • 3Faculty of Social Sciences,Hong Kong Baptist University, Hong Kong 999077, China
  • show less
    DOI: 10.12082/dqxxkx.2020.190502 Cite this Article
    Boyang GAO, Huilin LUO, Zhiji HUANG, Fanya XU, Baihong LIU. Research on the Spatial Layout of and Factors Affecting the Price of Industrial Land in China[J]. Journal of Geo-information Science, 2020, 22(6): 1189 Copy Citation Text show less
    Spatio-temporal distribution of industrial land transfer from 2009 to 2017
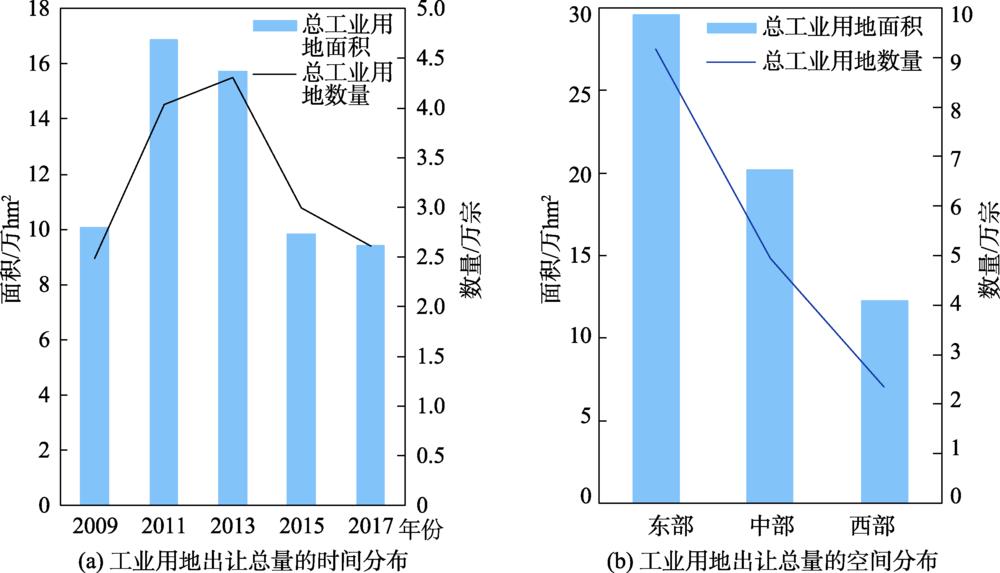
    Fig. 1. Spatio-temporal distribution of industrial land transfer from 2009 to 2017
    Spatial pattern of industrial land transfer from 2009 to 2017
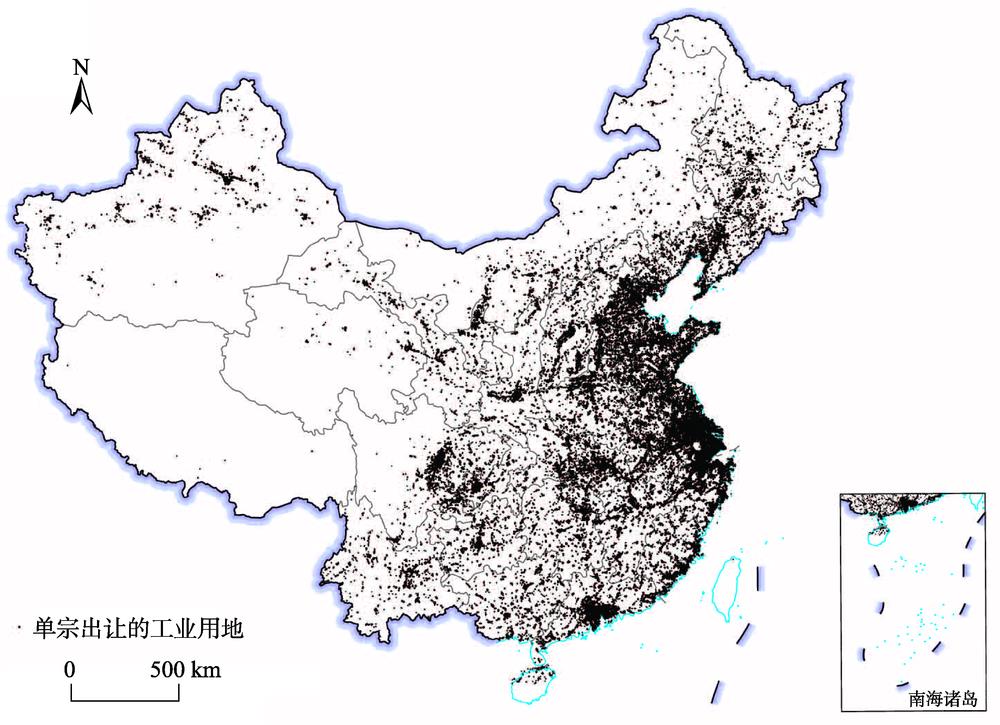
    Fig. 2. Spatial pattern of industrial land transfer from 2009 to 2017
    Spatio-temporal pattern of industrial land price evolution from 2009 to 2017
    Fig. 3. Spatio-temporal pattern of industrial land price evolution from 2009 to 2017
    Full sample distribution and annual sample distribution of industrial land price hotspots from 2009 to 2017
    Fig. 4. Full sample distribution and annual sample distribution of industrial land price hotspots from 2009 to 2017
    变量类别变量符号变量名称变量含义及测算方法数据来源
    因变量Price工业用地出让单价工业用地出让价格/工业用地出让面积土地市场交易数据[34]
    宗地变量DZX城市中心影响度宗地与地方政府所在地的距离GIS实测
    DHCZ火车站宗地与火车站的最近距离GIS实测
    DJC机场宗地与机场的最近距离GIS实测
    DGL主要公路宗地与主要公路的最近距离GIS实测
    DSY水源宗地与河流、湖泊的最近距离GIS实测
    城市变量GH_P政府行为(价格)(政策要求当年工业地价最低标准—城市当年工业平均地价)/政策要求当年工业地价最低标准本文计算
    GH_K政府行为(开发区)宗地在工业园内部=1,否则为其他虚拟变量
    T1*GH_P2010年政府行为(价格)T1=1,宗地在2011年出让;T1*GH,政府在2010年对工业用地出让采取的行为(价格)本文计算
    T2*GH_P2012年政府行为(价格)T2=1,宗地在2013年出让;T2*GH,政府在2012年对工业用地出让采取的行为(价格)本文计算
    T3*GH_P2014年政府行为(价格)T3=1,宗地在2015年出让;T3*GH,政府在2014年对工业用地出让采取的行为(价格)本文计算
    T4*GH_P2016年政府行为(价格)T4=1,宗地在2017年出让;T4*GH,政府在2016年对工业用地出让采取的行为(价格)本文计算
    perGDP人均生产总值各地区人均地区生产总值《中国城市统计年鉴》[35]
    SEC产业结构第二产业占GDP的比重《中国城市统计年鉴》[35]
    PP人口数量各地区年末总人口数量《中国城市统计年鉴》[35]
    W城市区位W=1,城市属于西部地区,否则为其他虚拟变量
    E城市区位E=1,城市属于东部地区,否则为其他虚拟变量
    Table 1. Factors affecting industrial land price
    变量机场主要公路火车站水源市中心政府行为(价格)政府行为(开发区)人均生产总值产业结构人口数量
    机场1
    主要公路-0.051
    火车站0.30-0.031
    水源0.24-0.050.091
    市中心0.25-0.040.360.151
    政府行为(价格)0.110.010.020.000.101
    政府行为(开发区)0.010.05-0.01-0.020.020.061
    人均生产总值-0.210.07-0.03-0.23-0.04-0.23-0.051
    产业结构0.00-0.010.010.000.010.000.00-0.021
    人口数量-0.21-0.01-0.07-0.08-0.01-0.060.020.170.001
    Table 2. Correlation coefficient table
    变量工业地价(1)工业地价(2)工业地价(3)工业地价(4)
    宗地层面机场-0.012***-1.161***
    主要公路0.117***11.430***
    火车站-0.030***-2.995***
    水源-0.018***-1.714***
    市中心-0.013***-1.300***
    城市层面政府行为(价格)-0.285***-0.260***-0.251***-0.160***
    政府行为(园区)-0.068***-0.065***0.025***0.024***
    2010年政府行为(价格)-0.072***-0.001-0.073
    2012年政府行为(价格)-0.111***0.023***-0.180***
    2014年政府行为(价格)-0.023**-0.015-0.054
    2016年政府行为(价格)0.006-0.048***-0.019
    人均生产总值0.005***
    产业结构0.003
    人口数量0.073***
    西部-0.211***
    东部0.238***
    Constant5.198***5.185***5.125***5.112***
    观测值164 361164 361164 361164 361
    Table 3. Full-sample estimation results of factors affecting industrial land price from 2009 to 2017
    变量2009年地价2011年地价2013年地价2015年地价2017年地价
    宗地层面机场-1.168***-1.109***-1.269***-1.387***-0.756***
    主要公路15.830***19.248***16.605***-6.288*5.286
    火车站-4.618***-2.614***-2.570***-3.108***-2.762***
    水源-0.688*-1.865***-1.695***-2.592***-1.655***
    市中心-1.501***-1.741***-1.252***-0.932***-1.084***
    城市层面政府行为(价格)-0.270***-0.258***-0.375***-0.188***-0.154***
    政府行为(园区)0.073***0.052***0.028***-0.014*-0.027***
    人均生产总值0.026***0.014**0.003-0.000-0.002
    产业结构-30.4900.005-0.129-22.912-6.603
    人口数量0.068***0.075***0.073***0.071***0.061***
    西部-0.166**-0.210***-0.217***-0.221***-0.216***
    东部0.196***0.187***0.271***0.270***0.296***
    Constant4.909***4.896***4.919***5.264***5.186***
    观测值24 86040 37743 08929 89926 136
    Table 4. Annual estimation results of factors affecting industrial land price from 2009 to 2017
    变量东部中部西部
    机场-1.303***-0.246***-0.910***
    主要公路3.532*28.143***-1.141
    火车站-2.402***-2.869***-1.738***
    水源-0.986***-0.947***-3.315***
    市中心-3.696***-2.683***-0.400***
    政府行为(价格)-0.141**-0.080*-0.420***
    政府行为(园区)0.039***0.038***-0.073***
    2010年政府行为(价格)0.028-0.198***0.018
    2012年政府行为(价格)-0.092-0.236***-0.077
    2014年政府行为(价格)0.048-0.328***-0.032
    2016年政府行为(价格)0.061-0.323***-0.060
    人均生产总值0.032***-0.001-0.009***
    产业结构-75.600***0.00421.340
    人口数量0.044***0.105***0.033***
    Constant5.699***5.008***4.696***
    观测值915874932423450
    Table 5. Sub-regional estimation results of factors affecting industrial land price from 2009 to 2017
    Boyang GAO, Huilin LUO, Zhiji HUANG, Fanya XU, Baihong LIU. Research on the Spatial Layout of and Factors Affecting the Price of Industrial Land in China[J]. Journal of Geo-information Science, 2020, 22(6): 1189
    Download Citation