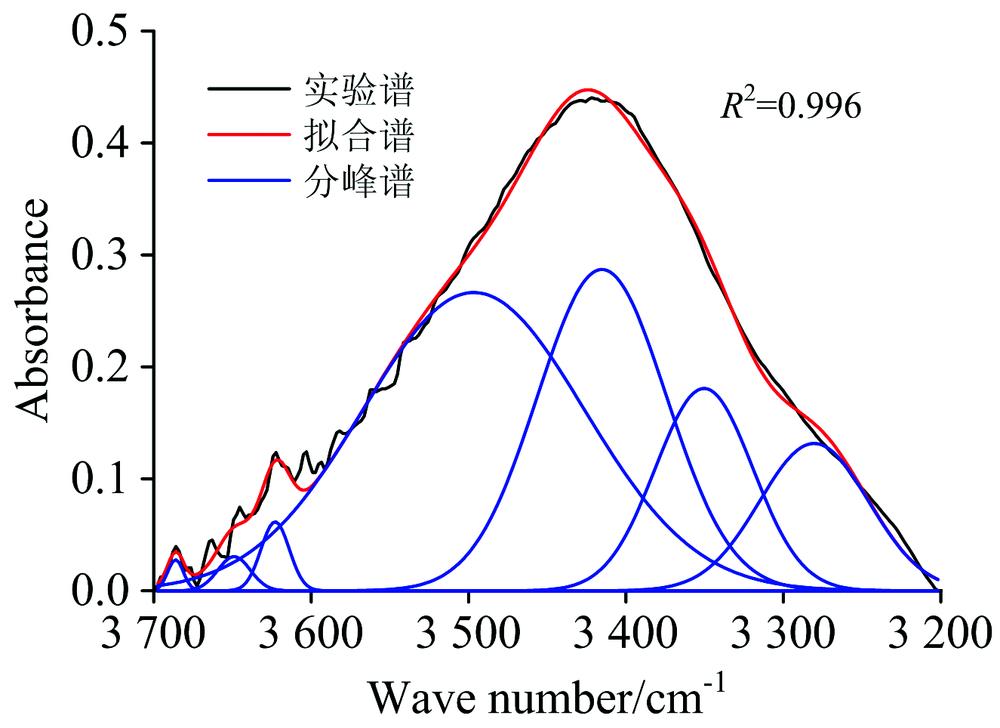
Fig. 1. Hydroxy FTIR fitting spectra of coal
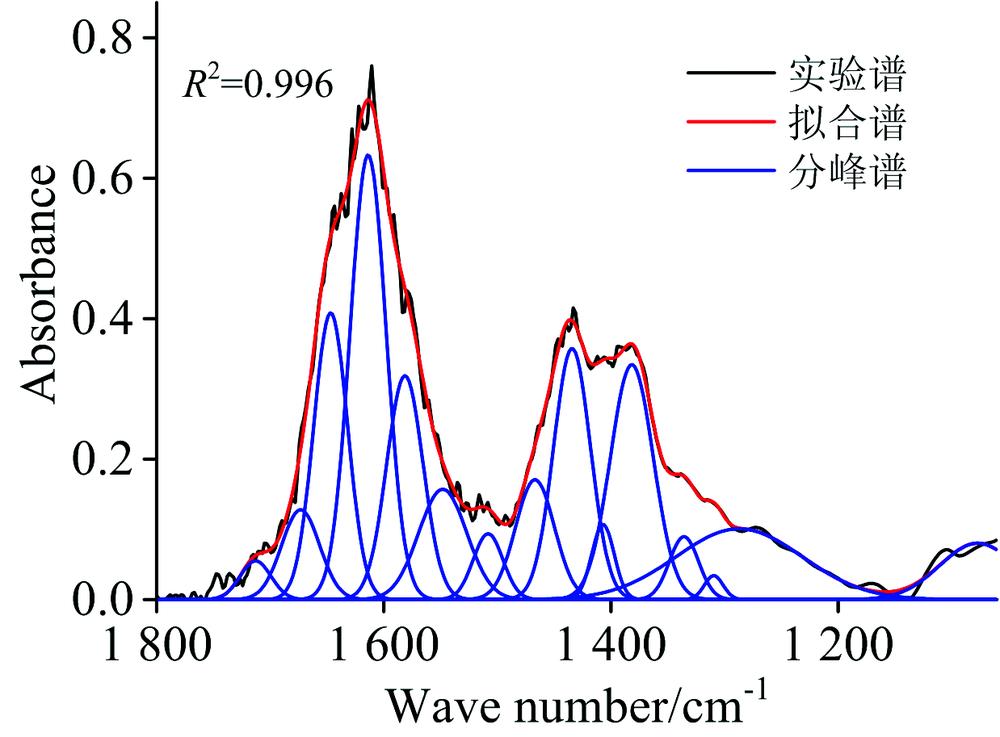
Fig. 2. Oxygen groups FTIR fitting spectra of coal
Fig. 3. FTIR fitting spectra of aliphatic hydrocarbon structure in coal
Fig. 4. FTIR fitting spectra of aromatic hydrocarbon structure in coal
Fig. 5. 13C CP/MAS-NMR fitting spectra of coal
Fig. 6. XPS fitting spectra of S(2p) in coal
Fig. 7. XPS fitting spectra of N(1s) in coal
Fig. 8. Molecular structural unit model in high sulfur gas-fat coal of Gaoyang
工业分析/% | 元素分析/% | 形态硫分析% | H/C | O/C |
---|
Mad | Aad | Vdaf | Cdaf | Hdaf | Odaf | Ndaf | Sdaf | Ss | Sp | So |
---|
1.60 | 12.13 | 34.67 | 84.78 | 5.30 | 5.52 | 1.29 | 3.11 | 5.08 | 13.02 | 81.90 | 0.75 | 0.05 |
|
Table 1. Coal quality analysis
峰位置 /cm-1 | 峰面积 | 相对 含量/% | 化学结构 |
---|
3 686 | 0.35 | 0.33 | Free hydroxyl groups | 3 649 | 0.81 | 0.77 | Free hydroxyl groups | 3 623 | 1.38 | 1.32 | Free hydroxyl groups | 3 497 | 47.00 | 45.00 | OH…π | 3 415 | 29.45 | 28.20 | OH…π | 3 350 | 14.02 | 13.42 | OH…OH | 3 281 | 11.44 | 10.96 | OH…O |
|
Table 2. FTIR analysis for hydroxyl groups in coal
峰位置 /cm-1 | 峰面积 | 相对含量 /% | 化学结构 |
---|
1 077 | 6.71 | 4.91 | aryl ethers | 1 287 | 14.01 | 10.25 | C—O phenols | 1 309 | 0.70 | 0.51 | C—O phenols | 1 336 | 2.88 | 2.11 | C—O phenols | 1 382 | 15.84 | 11.59 | —CH3 | 1 407 | 2.64 | 1.93 | —CH3, —CH2 | 1 434 | 14.62 | 10.70 | —CH3, —CH2 | 1 467 | 7.32 | 5.35 | —CH3, —CH2 | 1 508 | 3.08 | 2.25 | aromatic C=C | 1 548 | 8.34 | 6.10 | aromatic C=C | 1 581 | 12.82 | 9.38 | aromatic C=C | 1 613 | 25.2 | 18.45 | conjugated C=C | 1 647 | 15.29 | 11.18 | conjugated C=O | 1 673 | 5.36 | 3.92 | carboxylic acid | 1 712 | 1.87 | 1.37 | carboxylic acid |
|
Table 3. Oxygen containing functional groups in coal FTIR analytical
峰位置 /cm-1 | 峰面积 | 相对含量 /% | 化学结构 |
---|
2 844 | 2.81 | 17.55 | sym.R2CH2 | 2 861 | 1.83 | 11.43 | sym.R2CH2 | 2 885 | 2.25 | 14.05 | sym.R3CH | 2 904 | 2.28 | 14.24 | sym.R3CH | 2 917 | 2.06 | 12.87 | asym.R2CH2 | 2 929 | 2.19 | 13.68 | asym.RCH3 | 2 948 | 1.75 | 10.81 | asym.RCH3 | 2 962 | 0.72 | 4.50 | asym.RCH3 | 2 999 | 0.14 | 0.87 | asym.RCH3 |
|
Table 4. FTIR analysis for aliphatic hydrocarbon structure in coal
峰位置 /cm-1 | 峰面积 | 相对 含量/% | 化学结构 |
---|
740 | 0.67 | 8.11 | 2 adjacent H deformation | 752 | 1.64 | 19.82 | 3 adjacent H deformation | 800 | 2.00 | 24.23 | 4 adjacent H deformation | 817 | 0.53 | 6.42 | 4 adjacent H deformation | 861 | 0.51 | 6.23 | 5 adjacent H deformation | 874 | 2.91 | 35.19 | 5 adjacent H deformation |
|
Table 5. FTIR analysis for aromatic hydrocarbon structure in coal
化学位移, 10-6 | 主要官能团结构 |
---|
14~20 | R-CH3 | 20~26 | Ar-CH3 | 26~35 | —CH2— | 35~50 | CH, C | 50~60 | O—CH3, O—CH2— | 60~70 | O—CH | 75~90 | R—O—R | 100~129 | Ar—H | 129~148 | Bridgehead(C—C) | 148~165 | Ar—O | 165~185 | —COOH | 185~200 | —C=O |
|
Table 6. 13C CP/MAS-NMR functional groups and chemical shift
far | fal | | | | | f'a | | | | | | Xb | Har/H |
---|
0.77 | 0.23 | 0.06 | 0.14 | 0.03 | 0.03 | 0.74 | 0.26 | 0.48 | 0.12 | 0.32 | 0.04 | 0.43 | 0.35 |
|
Table 7. 13C-NMR structural parameters in coal
特征峰归属 | 电子结合能/eV | 峰面积 | 相对含量/% |
---|
硫醚(醇) | 163.70 | 1 001.13 | 18.40 | 噻吩 | 164.09 | 1 952.44 | 35.90 | (亚)砜 | 165.15 | 1 502.00 | 27.61 | 无机硫 | 170.00 | 983.99 | 18.09 |
|
Table 8. XPS analysis of S(2p) in coal
特征峰归属 | 电子结合能/eV | 峰面积 | 相对含量/% |
---|
吡啶氮 | 398.78 | 3 585.05 | 49.20 | 吡咯氮 | 400.41 | 1 752.85 | 24.05 | 质子化吡啶 | 401.52 | 1 425.41 | 19.56 | 氮氧化物 | 403.00 | 523.33 | 7.19 |
|
Table 9. XPS analysis of N(1s) in coal
Table 10. Aromatic structural unit in coal molecular structure model