• Chinese Optics Letters
  • Vol. 19, Issue 11, 111101 (2021)
Yi Wei1、2, Pingli Han1、2、3, Fei Liu1、2、*, Jinpeng Liu1、2, and Xiaopeng Shao1、2
Author Affiliations
  • 1School of Physics and Optoelectronic Engineering, Xidian University, Xi’an 710071, China
  • 2Xi’an Key Laboratory of Computational Imaging, Xi’an 710071, China
  • 3Key Laboratory of Optical Engineering, Chinese Academy of Sciences, Chengdu 610209, China
  • show less
    DOI: 10.3788/COL202119.111101 Cite this Article Set citation alerts
    Yi Wei, Pingli Han, Fei Liu, Jinpeng Liu, Xiaopeng Shao. Polarization descattering imaging: a solution for nonuniform polarization characteristics of a target surface[J]. Chinese Optics Letters, 2021, 19(11): 111101 Copy Citation Text show less
    Real underwater imaging results. (a) Raw intensity image. (b) Reconstruction result by traditional polarization methods. (c) Ideal reconstruction result.
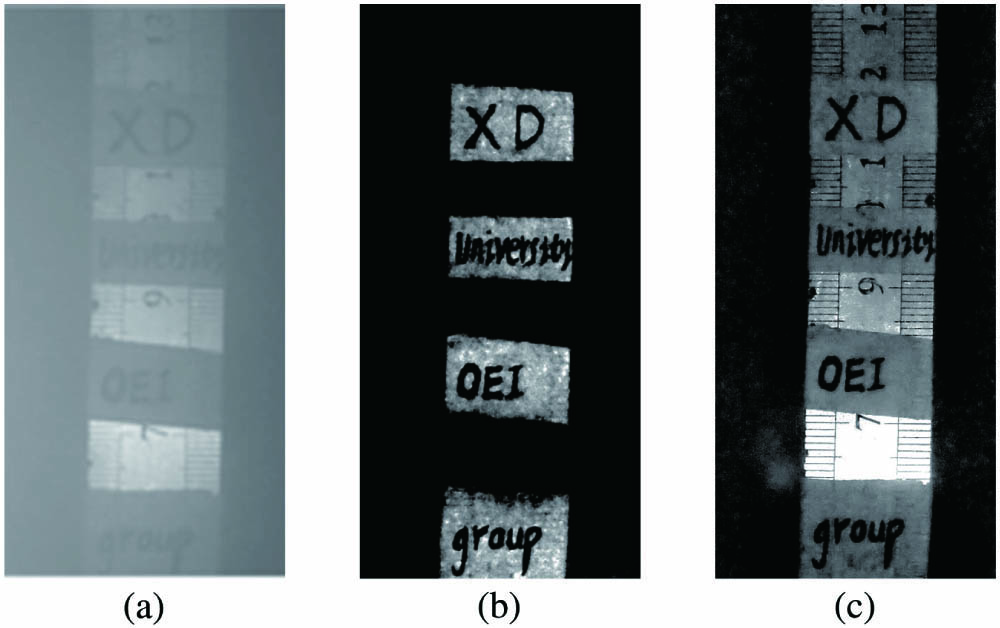
    Fig. 1. Real underwater imaging results. (a) Raw intensity image. (b) Reconstruction result by traditional polarization methods. (c) Ideal reconstruction result.
    Relationship between the degree of distortion of traditional polarization imaging methods and the target polarization information (DOP and AOP).
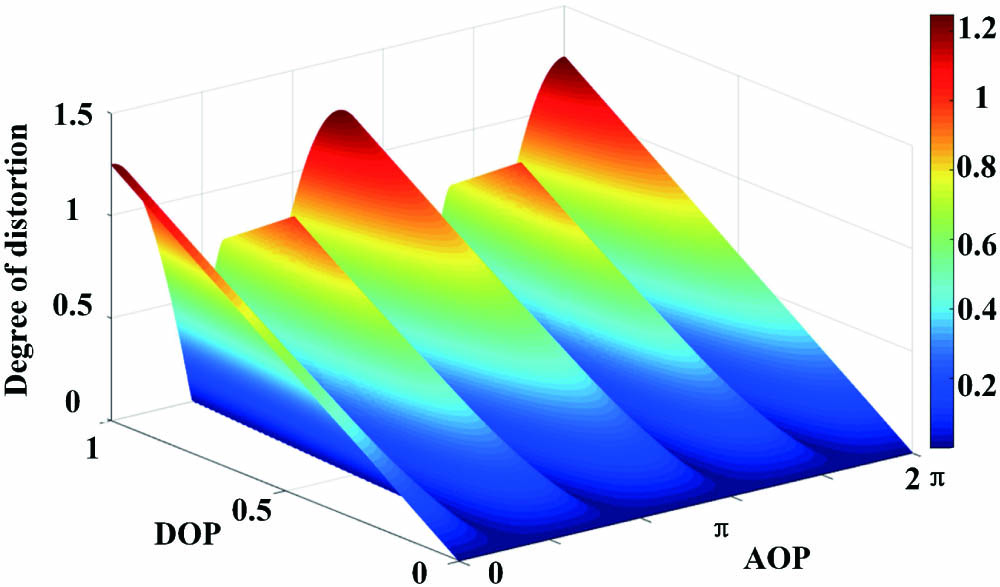
    Fig. 2. Relationship between the degree of distortion of traditional polarization imaging methods and the target polarization information (DOP and AOP).
    Polarization imaging model. (a) Schematic of the propagation process of target information in an underwater environment. A three-dimensional coordinate system is established by taking the propagation direction of reflected light as the positive direction of the z axis into consideration. (b) Schematic of the relationship among the intensities of Itotal, Itarget, and Iscat. (c) Schematic of the relationship among the AOP of Itotal, Itarget, and Iscat.
    Fig. 3. Polarization imaging model. (a) Schematic of the propagation process of target information in an underwater environment. A three-dimensional coordinate system is established by taking the propagation direction of reflected light as the positive direction of the z axis into consideration. (b) Schematic of the relationship among the intensities of Itotal, Itarget, and Iscat. (c) Schematic of the relationship among the AOP of Itotal, Itarget, and Iscat.
    MI of Tp and Sp versus θ. (a) The whole curve of MI as a function of θ. (b) Zoom into the marked part of the plot (a).
    Fig. 4. MI of Tp and Sp versus θ. (a) The whole curve of MI as a function of θ. (b) Zoom into the marked part of the plot (a).
    Schematic of the experimental setup.
    Fig. 5. Schematic of the experimental setup.
    Experimental results. (a), (b), (c), and (d) are the intensity images obtained directly by the detector, and (e), (f), (g), and (h) are the reconstruction results obtained using the proposed method.
    Fig. 6. Experimental results. (a), (b), (c), and (d) are the intensity images obtained directly by the detector, and (e), (f), (g), and (h) are the reconstruction results obtained using the proposed method.
    Visualizing the improvement resulting from using the proposed method. (a) and (b) are intensity profiles along the white dotted lines in Figs. 6(a), 6(b), 6(e), and 6(f).
    Fig. 7. Visualizing the improvement resulting from using the proposed method. (a) and (b) are intensity profiles along the white dotted lines in Figs. 6(a), 6(b), 6(e), and 6(f).
    Simulated images. (a) Clear image. (b) Total intensity image. (c), (d), (e), and (f) are the 0°, 45°, 90°, and 135° polarization subimages, respectively.
    Fig. 8. Simulated images. (a) Clear image. (b) Total intensity image. (c), (d), (e), and (f) are the 0°, 45°, 90°, and 135° polarization subimages, respectively.
    Simulation results. The images in the first row represent the reconstruction results obtained using different methods, the images in the second row represent the differences between the reconstruction results obtained using different methods and the original clear image, and the data below the images in the second row represent the degree of distortion of different methods.
    Fig. 9. Simulation results. The images in the first row represent the reconstruction results obtained using different methods, the images in the second row represent the differences between the reconstruction results obtained using different methods and the original clear image, and the data below the images in the second row represent the degree of distortion of different methods.
    Yi Wei, Pingli Han, Fei Liu, Jinpeng Liu, Xiaopeng Shao. Polarization descattering imaging: a solution for nonuniform polarization characteristics of a target surface[J]. Chinese Optics Letters, 2021, 19(11): 111101
    Download Citation