
A. Corvino, M. Reimold, E. Beyreuther, F.-E. Brack, F. Kroll, J. Pawelke, J. D. Schilz, M. Schneider, U. Schramm, M. E. P. Umlandt, K. Zeil, T. Ziegler, J. Metzkes-Ng, "miniSCIDOM: a scintillator-based tomograph for volumetric dose reconstruction of single laser-driven proton bunches," High Power Laser Sci. Eng. 12, 02000e17 (2024)
- High Power Laser Science and Engineering
- Vol. 12, Issue 2, 02000e17 (2024)
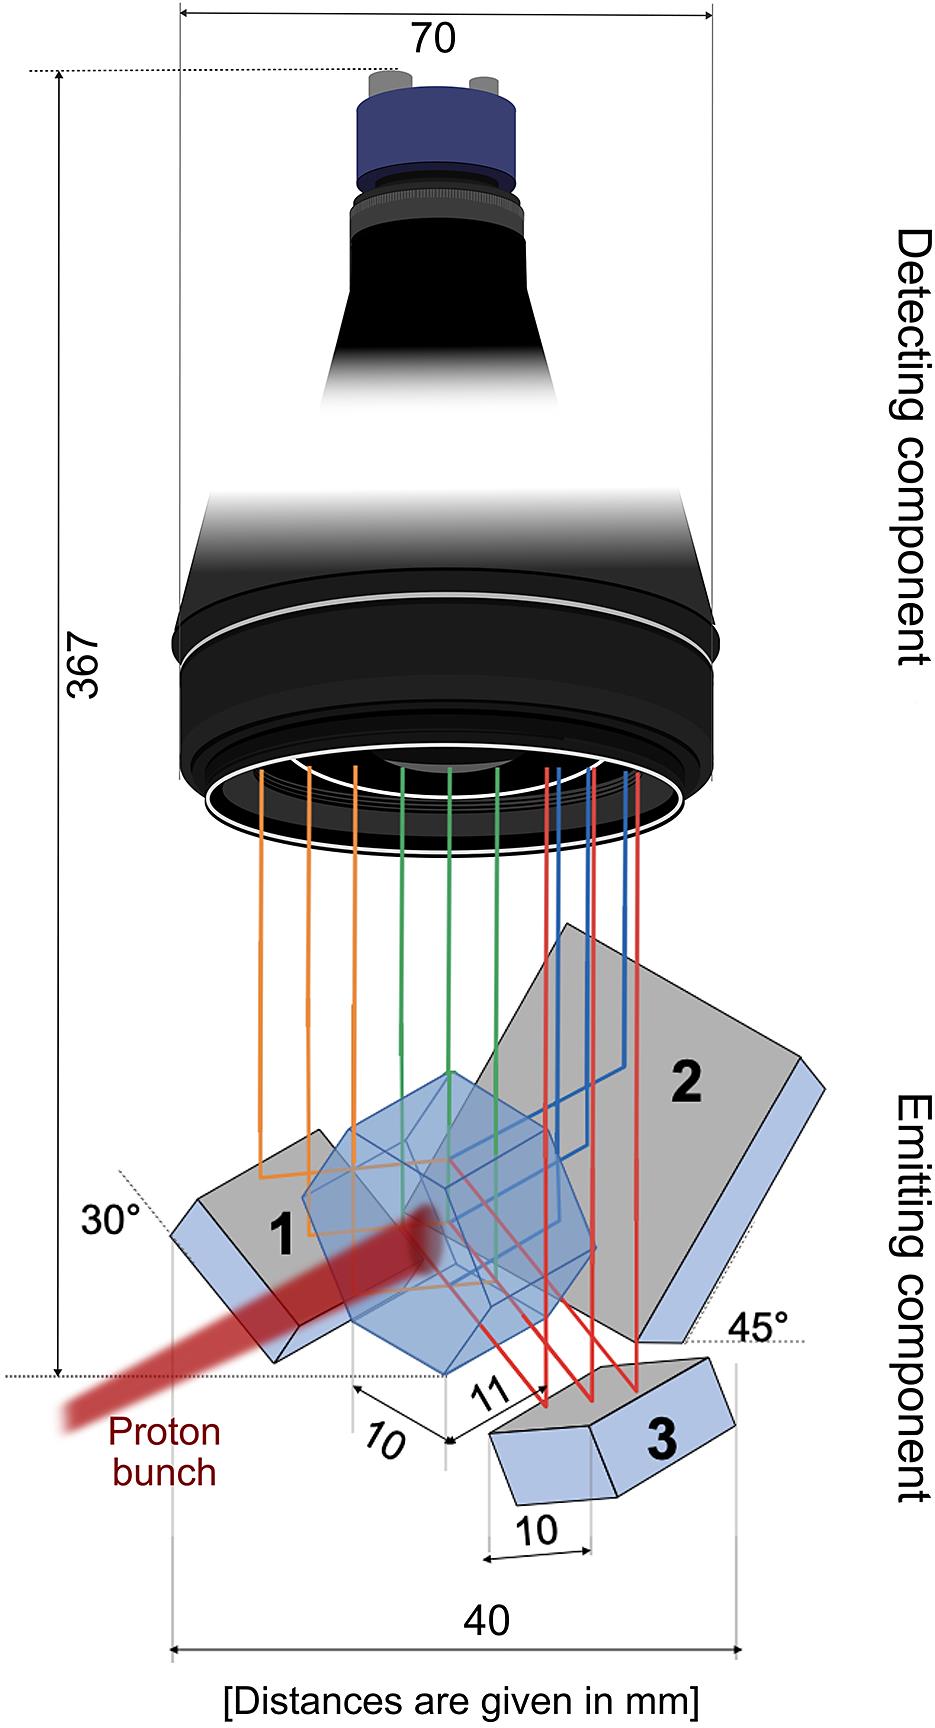
Fig. 1. The miniSCIDOM detector consists of a plastic scintillator shaped like a regular hexagonal prism. It is imaged via three mirrors, a bi-telecentric objective and a CCD camera.
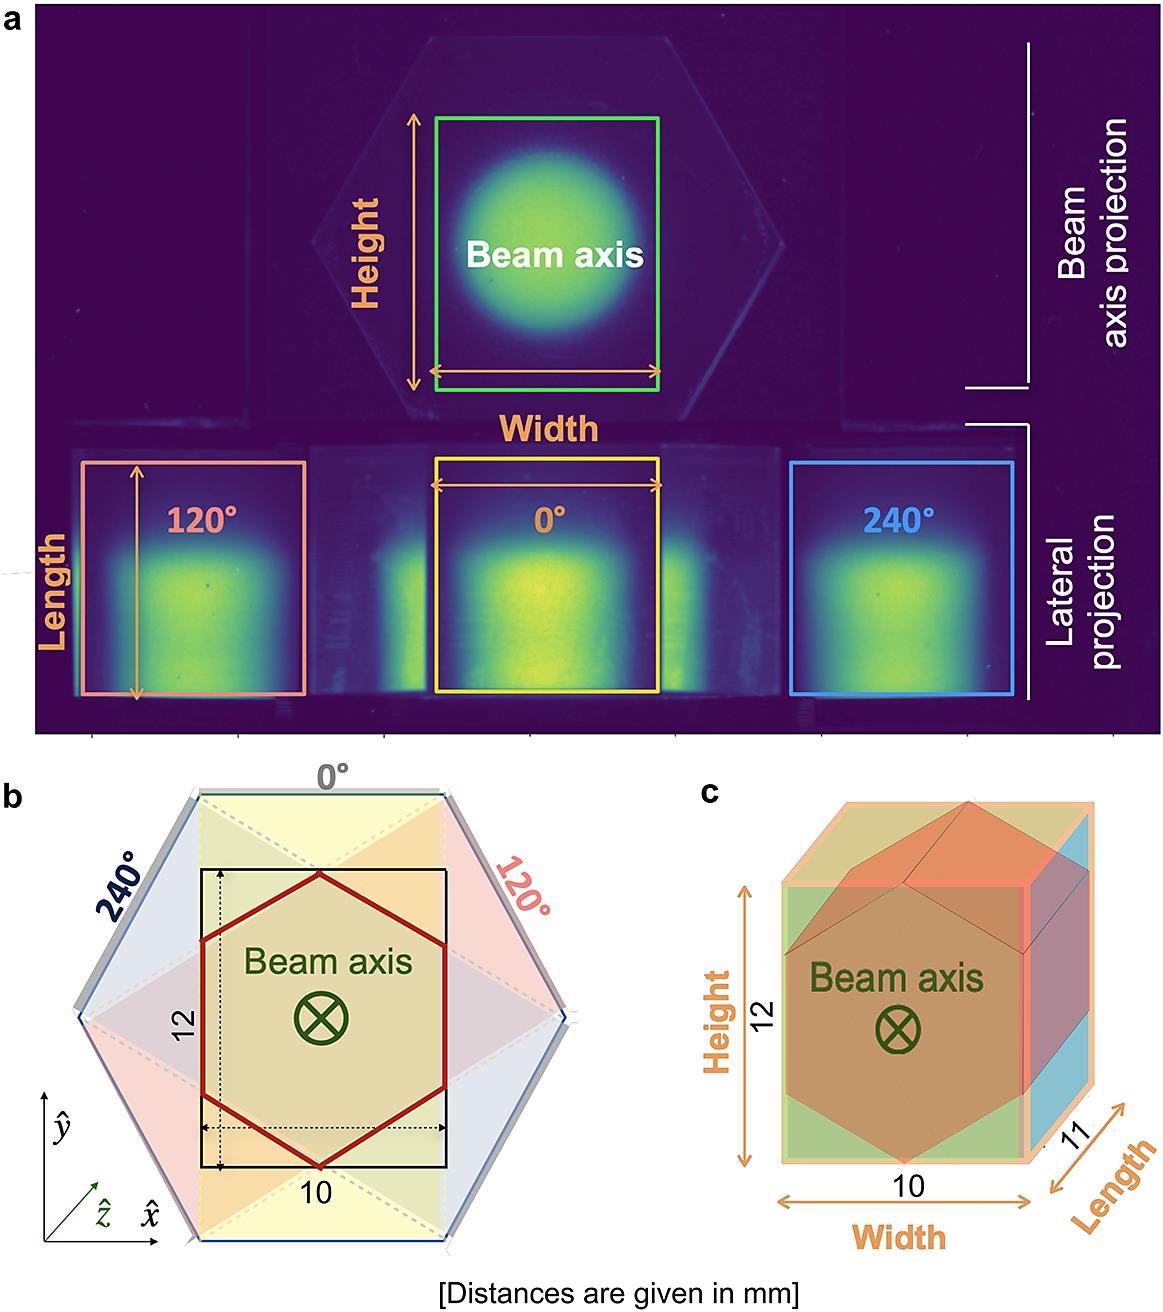
Fig. 2. Signal reconstruction. (a) False-colour raw data CCD camera image and selection of the different regions of interest (ROIs) for the four projections. The signal outside the ROI for the 0° projection corresponds to the signal imaged through the scintillator hexagon faces adjacent to the scintillator surface analysed for a specific projection. (b) Beam axis view of the scintillator with the lateral projection regions marked. The region where the lateral projections overlap (red hexagonal marking) is the lateral reconstruction area. (c) Volumetric representation of the reconstruction volume.
Fig. 3. miniSCIDOM depth dose measurements at a proton therapy cyclotron. The data show the miniSCIDOM reconstruction (marked as MS in the legend, light blue), the simulated depth dose curve (red), the radiochromic film (RCF) measurement (green), the simulated fluence-weighted linear energy transfer (LET, pink) and the LET-corrected miniSCIDOM measurement (orange). The depth dose profiles for the miniSCIDOM and RCF are averaged over a circular ROI with 5 mm diameter. All depth dose curves are individually normalized. (a) Pristine Bragg peak (PBP) irradiation of the miniSCIDOM. (b) Spread-out Bragg peak (SOBP) irradiation of the miniSCIDOM.
Fig. 4. Characterization of the spatial resolution with a perforated aluminium collimator, generating proton minibeams with 600  m diameter and 1 mm centre-to-centre spacing. (a) Measurement with a stack of radiochromic films (RCFs), where representative slices for the top, side and beam axis views are shown. (b) Measurement with the miniSCIDOM detector, where representative slices for the top, side and beam axis views derived from the reconstruction are shown. (c) Comparison between lateral profiles through the top views for the RCF and miniSCIDOM. The profiles are obtained at a fixed depth position (
z = 3 mm) and integrated over 3 pixels in the x direction. Note that due to its limited reconstruction volume, the miniSCIDOM only resolves eight minibeams, whereas the RCF stack resolves 10. The minibeams at positions y = 11 mm and y = 12 mm are artefact minibeams imaged from a hexagon face adjacent to the scintillator surface analysed for the projection under consideration.
m diameter and 1 mm centre-to-centre spacing. (a) Measurement with a stack of radiochromic films (RCFs), where representative slices for the top, side and beam axis views are shown. (b) Measurement with the miniSCIDOM detector, where representative slices for the top, side and beam axis views derived from the reconstruction are shown. (c) Comparison between lateral profiles through the top views for the RCF and miniSCIDOM. The profiles are obtained at a fixed depth position (Fig. 5. miniSCIDOM measurements at an LPA proton source. (a) Experimental setup including the LPA proton source driven by the Draco PW laser system and the ALBUS-2S beamline. A time-of-flight (ToF) spectrometer serves as a spectrally resolving beam monitoring system. (b) Comparison of an RCF stack irradiation with seven proton bunches and the according depth dose simulated based on the seven proton bunch spectra measured by the ToF spectrometer. The error bar associated with the simulated dose represents the sum of the energy uncertainty and proton number calibration uncertainty. The error bar associated with the measured dose represents the calibration uncertainty of 6%. (c) Absolutely calibrated ToF proton energy spectra ( ) for three single proton bunches as prepared by the ALBUS-2S beamline. The error bars take into account the spectral resolution of the ToF spectrometer and the uncertainty of the absolute calibration of the spectra. (d) Comparison of the depth dose distribution inside the miniSCIDOM as predicted based on the measured ToF proton spectra and the measurement with the miniSCIDOM. The error bars for the ToF measurement represent the propagation of the uncertainties in the spectral measurement. (e) For proton bunch 3, the depth dose curves from the miniSCIDOM measurement (MS, light blue) and the ToF-based prediction (blue) are shown. Moreover, the depth dose distribution is simulated including ionization quenching (red), and a correction for ionization quenching (orange) based on the fluence-weighted linear energy transfer (LET, pink) is applied to the miniSCIDOM data.
) for three single proton bunches as prepared by the ALBUS-2S beamline. The error bars take into account the spectral resolution of the ToF spectrometer and the uncertainty of the absolute calibration of the spectra. (d) Comparison of the depth dose distribution inside the miniSCIDOM as predicted based on the measured ToF proton spectra and the measurement with the miniSCIDOM. The error bars for the ToF measurement represent the propagation of the uncertainties in the spectral measurement. (e) For proton bunch 3, the depth dose curves from the miniSCIDOM measurement (MS, light blue) and the ToF-based prediction (blue) are shown. Moreover, the depth dose distribution is simulated including ionization quenching (red), and a correction for ionization quenching (orange) based on the fluence-weighted linear energy transfer (LET, pink) is applied to the miniSCIDOM data. Fig. 6. Analysis of the dose deposition dynamics at the LPA proton source based on Monte Carlo (MC) simulations for bunch 3 from Figure 5 . (a) Depth- and time-resolved dose deposition inside the miniSCIDOM for virtual depth layers. (b) The depth-resolved dose rate is calculated as the ratio of 80% of the total absorbed dose per layer and the time it takes for the absorbed dose to rise from 10% to 90%. (c) The depth-resolved proton flux is calculated by taking 80% of the total particle fluence at the corresponding depth and dividing it by the time interval in between which 10% and 90% of the dose are deposited.


Set citation alerts for the article
Please enter your email address

© Copyright 2018-2021 | Chinese Laser Press. All Rights Reserved 沪ICP备15018463号-20