
Dandan Zhang, Guang Zhang, Xijiang Chen, Ya Ban, Xiaosa Zhao, Lexian Xu. Flame Identification Algorithm Based on Improved Multi-Feature Fusion of YCbCr and Region Growth[J]. Laser & Optoelectronics Progress, 2020, 57(6): 061022
- Laser & Optoelectronics Progress
- Vol. 57, Issue 6, 061022 (2020)
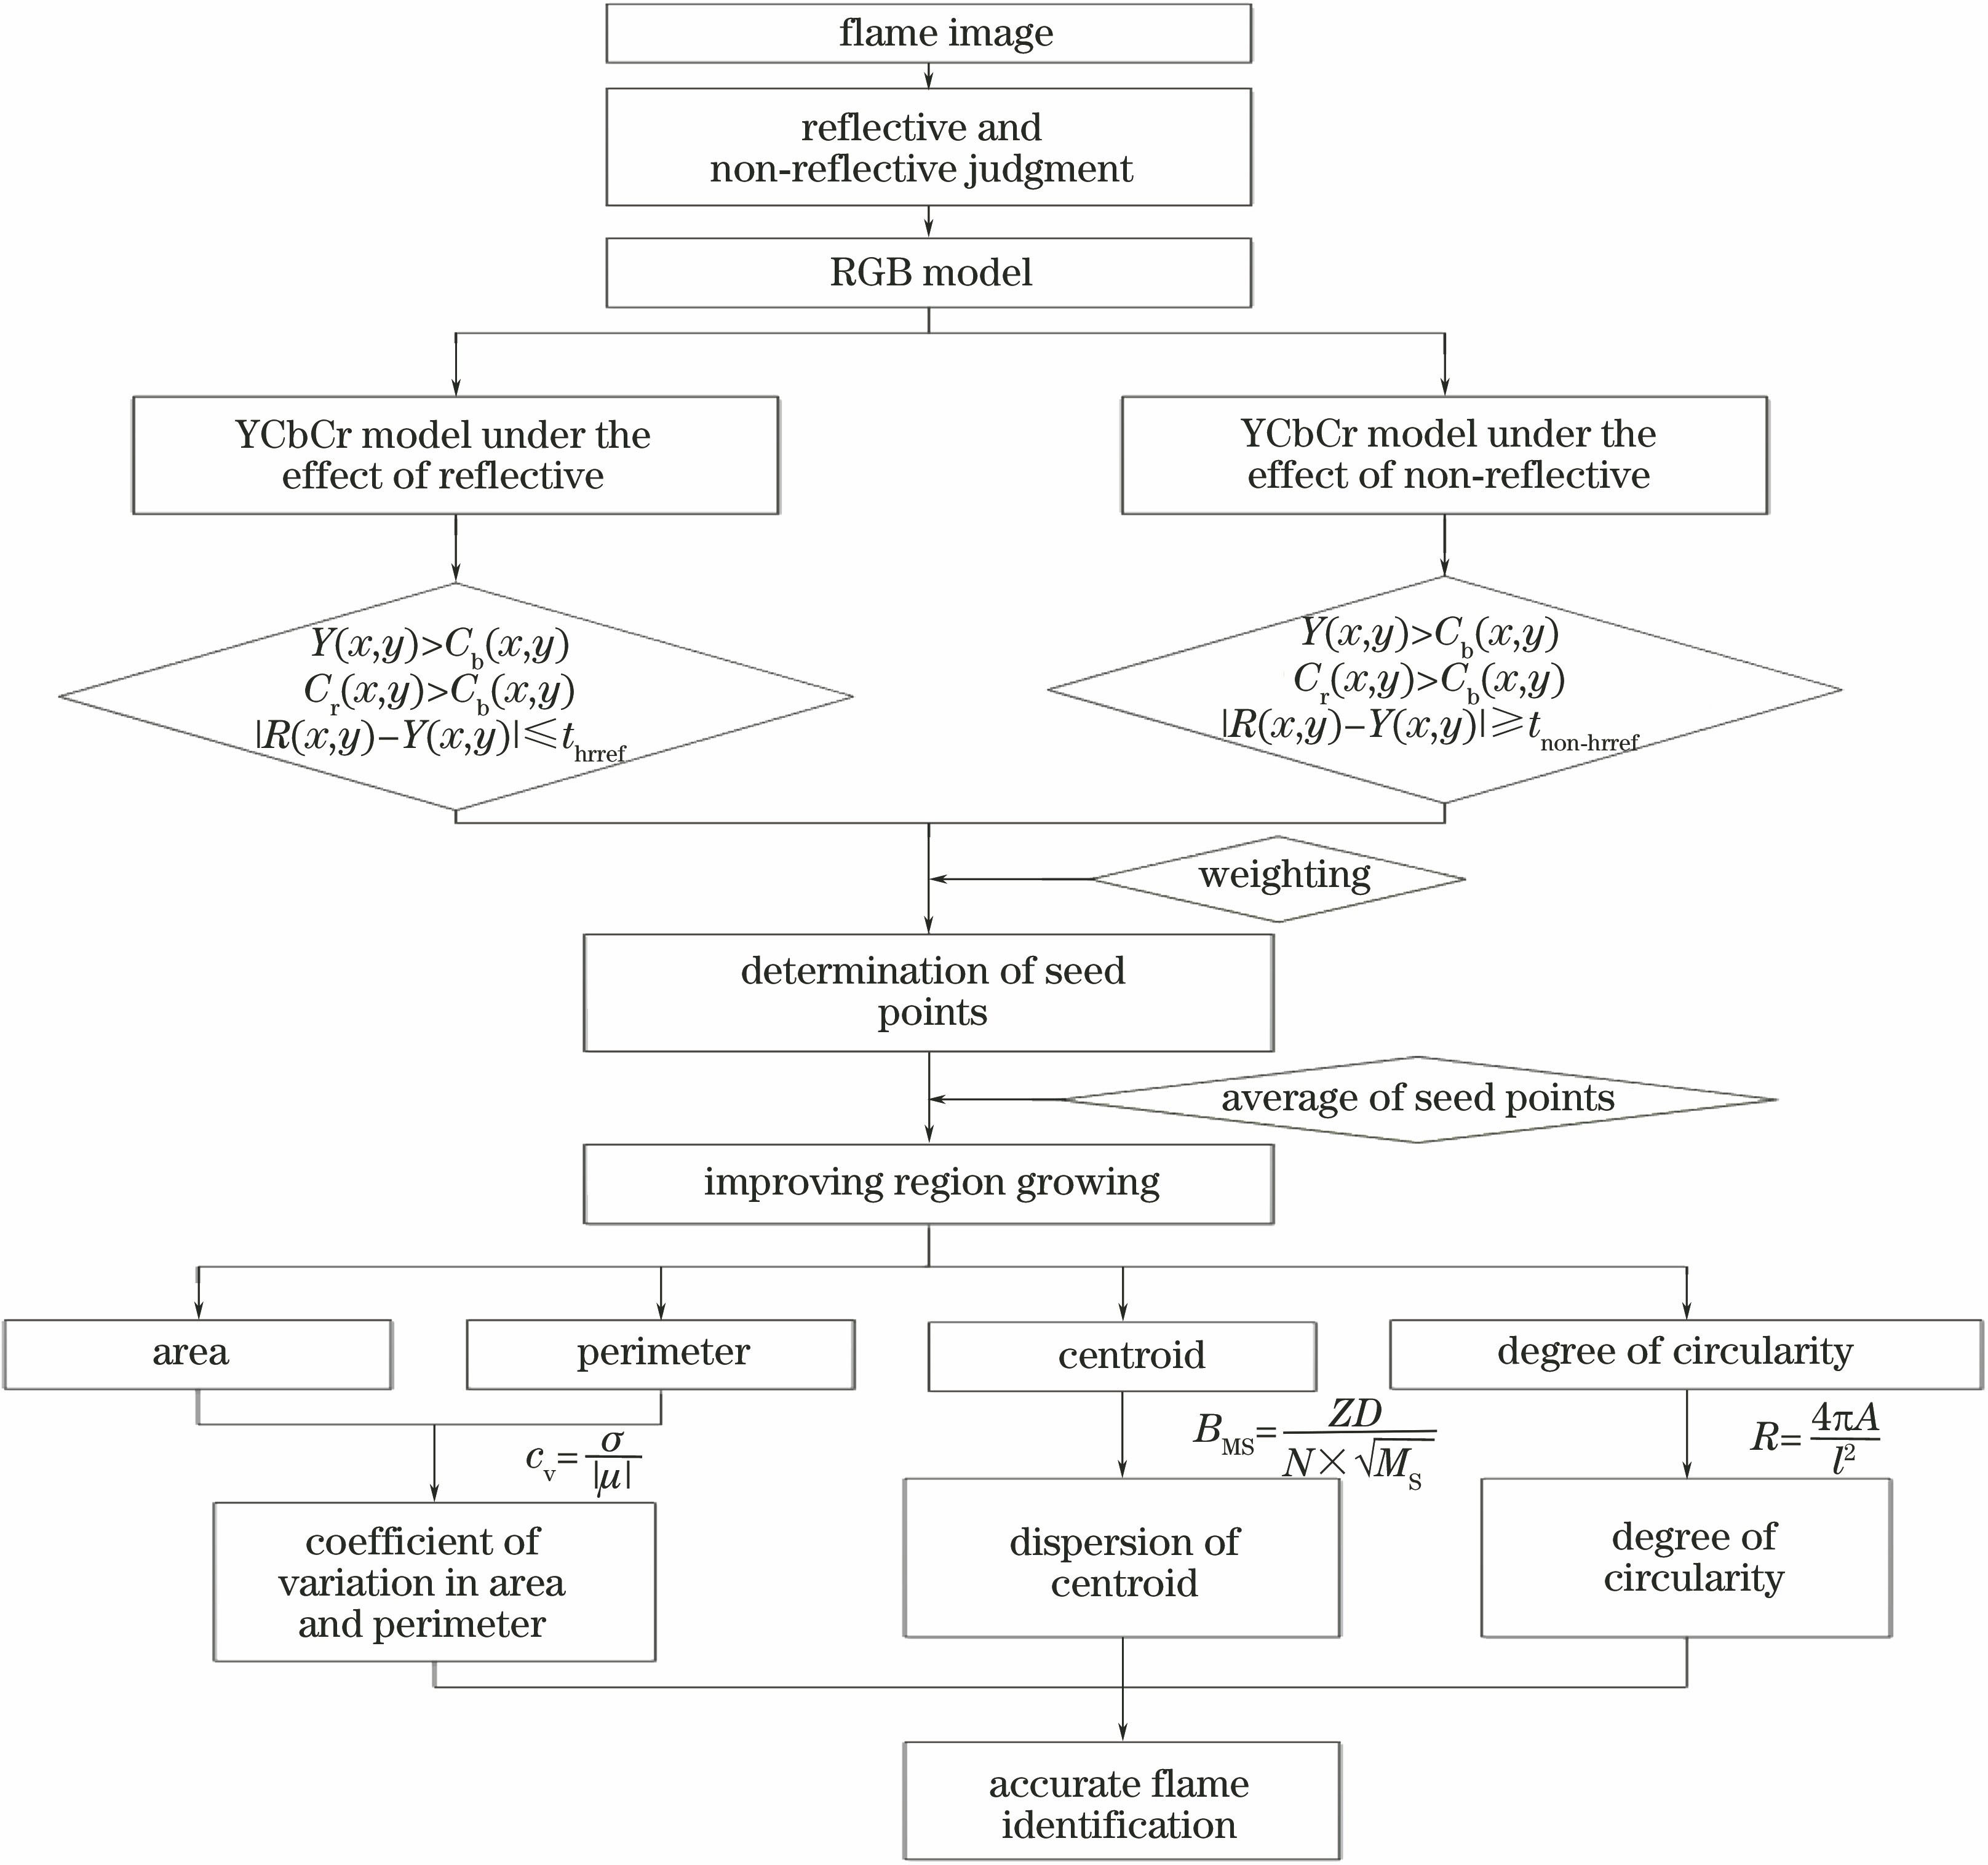
Fig. 1. Flow chart of proposed algorithm
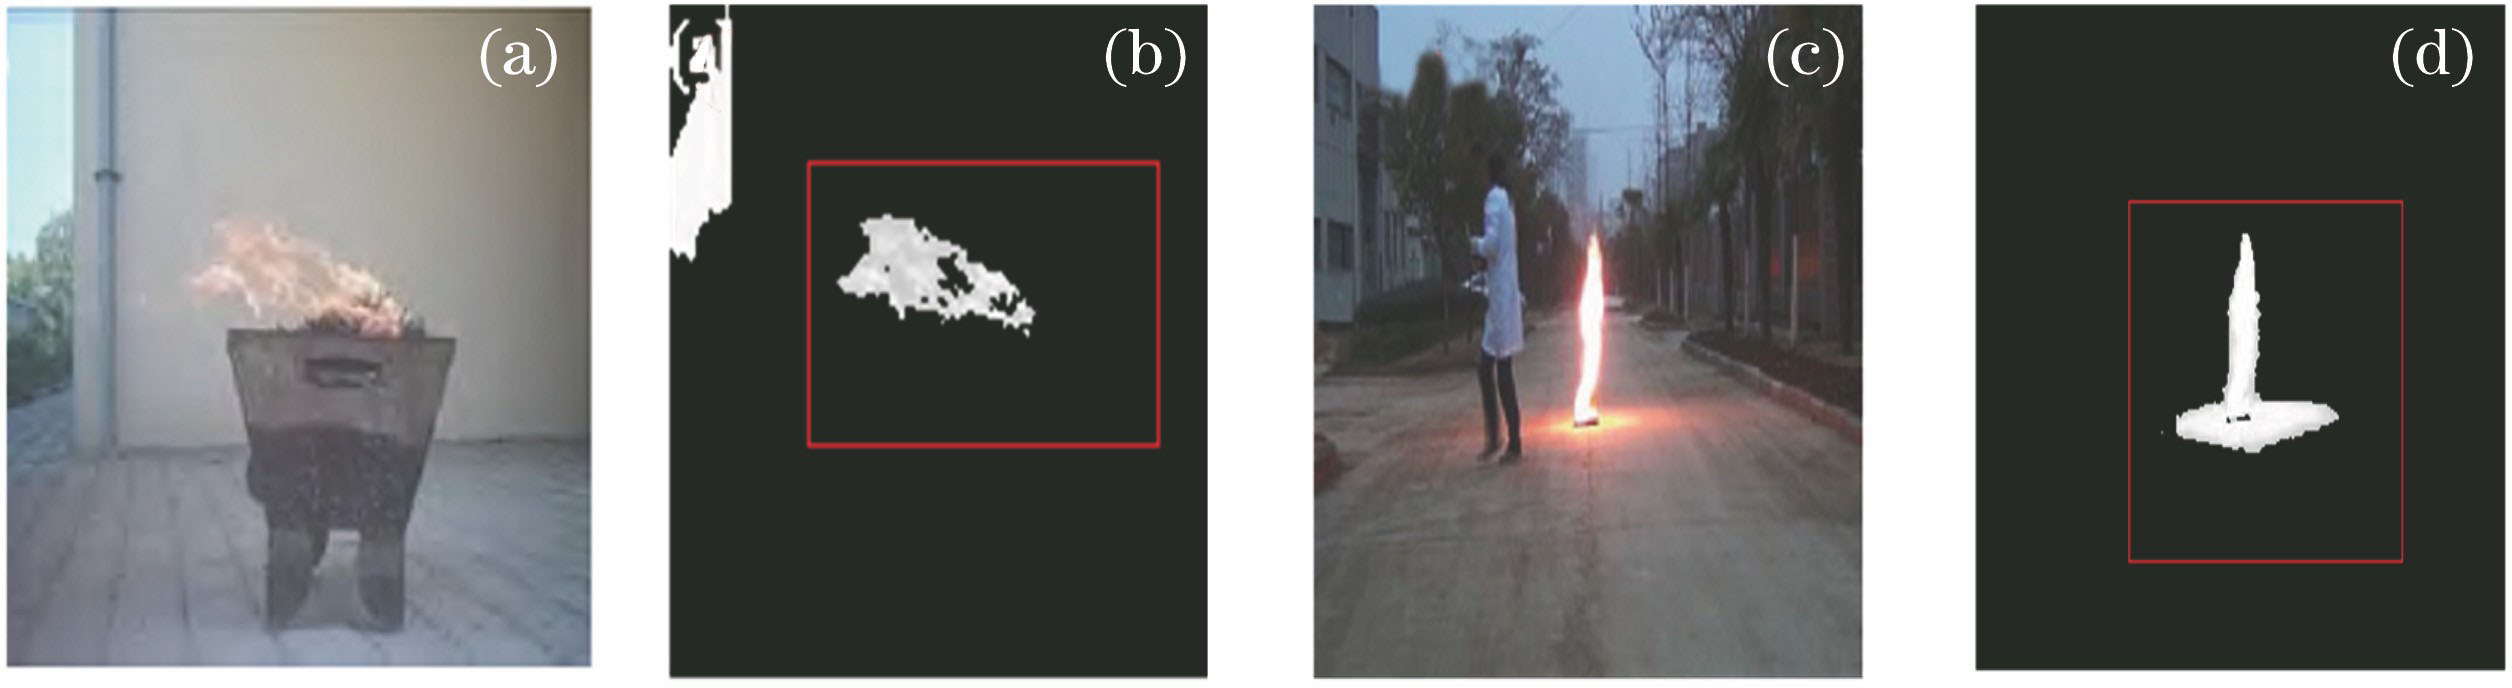
Fig. 2. Flame images with different brightness. (a)(c) Original images; (b) (d) brightness images of actual flame
Fig. 3. Original flame diagrams. (a) Non-reflective flame; (b) reflective flame
Fig. 4. Segmentation results of flame foreground region in the YCbCr color space model. (a) Non-reflective flame; (b) reflective flame
Fig. 5. Segmentation precision corresponding to different thresholds. (a) Reflective conditions; (b) non-reflective conditions
Fig. 6. Selection process of seed points. (a) Original image; (b) image segmentation; (c) centroid of connected area; (d) acquisition of seed points
Fig. 7. Improved region growing algorithm. (a) Seed point and its connected area adjacent to the pixel point; (b) merging of the initial seed point and the adjacent pixel point; (c) direction of region growth
Fig. 8. Comparison of segmentation results by the single-color models and the proposed method. (a)(e) Original images; (b)(f) RGB model; (c)(g) improved YCbCr model; (d)(h) proposed method
Fig. 9. Original images. (a) Candle; (b) light; (c) flame
Fig. 10. Segmentation results of flame and interference sources in Fig. 9 . (a) Candle; (b) light; (c) flame
Fig. 11. Experimental results of area change characteristics
Fig. 12. Experimental results on the variation characteristics of perimeter
Fig. 13. Experimental results of centroid movement characteristics
Fig. 14. Experimental results of circularity variation characteristics
Fig. 15. Comparison of segmentation effects for non-reflective area by different algorithms. (a) Original image; (b) proposed algorithm; (c) threshold segmentation algorithm; (d) color segmentation algorithm
Fig. 16. Comparison of segmentation effects for reflective area by different algorithms. (a) Original image; (b) proposed algorithm; (c) threshold segmentation algorithm; (d) color segmentation algorithm
|
Table 1. Comparison of flame area with different brightness
|
Table 3. Statistical values of coefficient of variation parameters calculated from area
|
Table 4. Statistical values of coefficient of variation parameters calculated from the perimeter
|
Table 5. Statistical values of centroid motion parameters calculated from area
| |||||||||||||||||||||
Table 6. Comparison of test results from different algorithms

Set citation alerts for the article
Please enter your email address
© Copyright 2018-2021 | Chinese Laser Press. All Rights Reserved 沪ICP备15018463号-20