
Bubin Wang, Bin Zhou, Hao Wang, Yongquan Xiong, Yihong Wang, Yangkun Zhu, Shimin Wang. Study on Calibration-Free Measurement Method for Gas Concentration Based on Triangular Wave Modulation[J]. Acta Optica Sinica, 2017, 37(9): 0930003
- Acta Optica Sinica
- Vol. 37, Issue 9, 0930003 (2017)
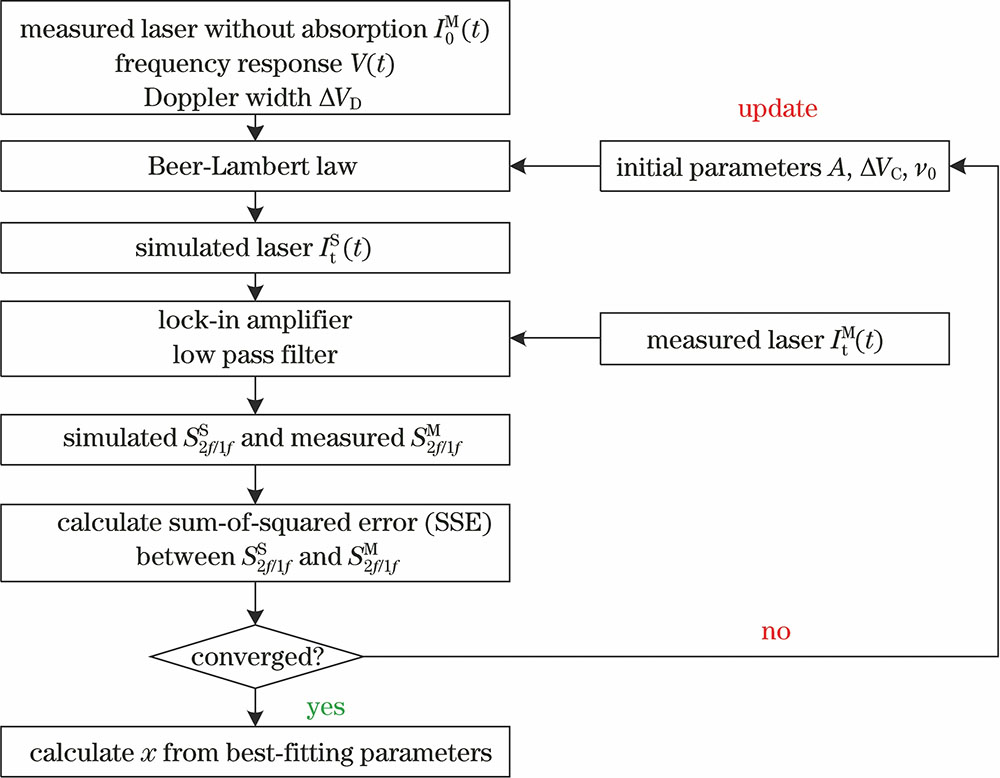
Fig. 1. Flow chart of calibration-free wavelength modulation inversion algorithm for concentration
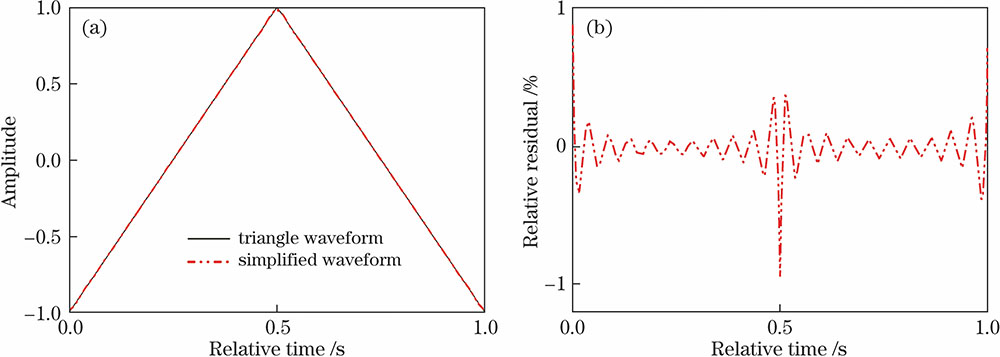
Fig. 2. (a) Amplitudes of triangle waveform and simplified waveform; (b) relative residual
Fig. 3. Measured and fitted frequency response of sine wave scanning superimposed by triangular wave modulation for DFB laser. (a) discrete points of laser frequency response and fitted curve of scanning term; (b) discrete points and fitted curve of frequency response of modulation term and coupling term; (c) relative residual between discrete points and fitted curves of modulation term and coupling term
Fig. 4. Schematic of experimental apparatus for measuring CH4 concentration without calibration
Fig. 5. Background light intensity signal and absorption signal of CH4 with mole fraction of 4.00%
Fig. 6. (a) Second harmonic signals of SM2f for triangle wave modulation and sine wave modulation at optimal modulation parameters; (b) experimental SM2f/1f and simulated SS2f/1f for CH4 with mole fraction of 4.00%; (c) relative residual between simulated SS2f/1f and experimental S2f/1fM
Fig. 7. (a) Measured mole fraction of 4.00%CH4 in 600 s; (b) Allan variance
Fig. 8. Measured mole fraction of CH4 in mixture gas of CH4 and N2
Fig. 9. Measured mole fraction of CH4 in mixture gas of CH4, N2 and CO2
|
Table 1. Fourier expanding coefficients Ai and ratio (Ki) of Ai to A1
|
Table 2. Parameters of fitting results of V(t)
|
Table 3. Main parameters of selected spectral lines
|
Table 4. Distribution list for different mole fractions of CH4(CH4/N2)
| |||||||||||||||||||||||||||||||||||||||||||||||||
Table 5. Distribution list for different mole fractions of CH4 (CH4/N2/CO2)

Set citation alerts for the article
Please enter your email address
© Copyright 2018-2021 | Chinese Laser Press. All Rights Reserved 沪ICP备15018463号-20