• Chinese Journal of Lasers
  • Vol. 48, Issue 13, 1306003 (2021)
Lingyu Sun, Changchao Liu, Mingshun Jiang, Lei Zhang, Faye Zhang, Qingmei Sui*, and Lei Jia
Author Affiliations
  • School of Control Science and Engineering, Shandong University, Jinan, Shandong 250061, China
  • show less
    DOI: 10.3788/CJL202148.1306003 Cite this Article Set citation alerts
    Lingyu Sun, Changchao Liu, Mingshun Jiang, Lei Zhang, Faye Zhang, Qingmei Sui, Lei Jia. Fatigue Crack Prediction Method for Aluminum Alloy Based on Fiber Bragg Grating Array[J]. Chinese Journal of Lasers, 2021, 48(13): 1306003 Copy Citation Text show less
    Flow chart of fatigue crack prediction based on FBG
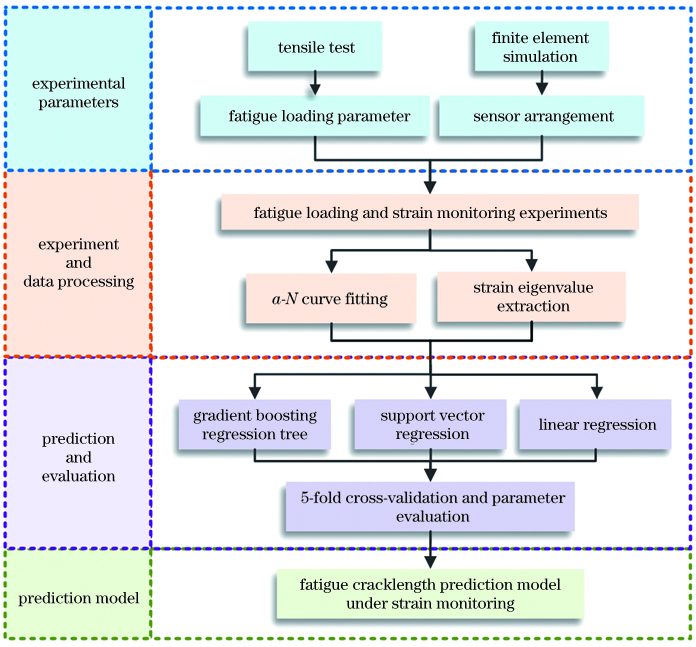
    Fig. 1. Flow chart of fatigue crack prediction based on FBG
    Component size diagram
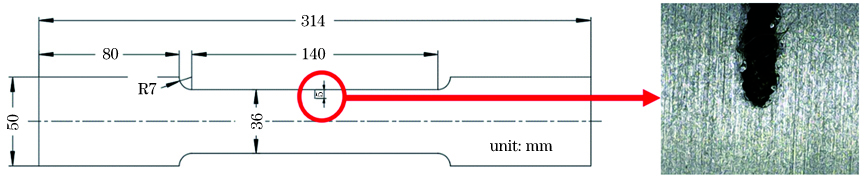
    Fig. 2. Component size diagram
    Strain field nephograms at different stages of crack propagation. (a) Crack initiation; (b) initial crack propagation; (c) steady crack propagation; (d) crack approaching failure
    Fig. 3. Strain field nephograms at different stages of crack propagation. (a) Crack initiation; (b) initial crack propagation; (c) steady crack propagation; (d) crack approaching failure
    Fatigue crack growth monitoring experimental system based on FBG
    Fig. 4. Fatigue crack growth monitoring experimental system based on FBG
    Overall schematic diagram of FBG demodulation system
    Fig. 5. Overall schematic diagram of FBG demodulation system
    Fatigue tensile results of samples 1--4
    Fig. 6. Fatigue tensile results of samples 1--4
    Schematic diagram of FBG sensor array
    Fig. 7. Schematic diagram of FBG sensor array
    Actual pasting position of FBG sensor array
    Fig. 8. Actual pasting position of FBG sensor array
    Fitting result of fatigue extension a-N curve
    Fig. 9. Fitting result of fatigue extension a-N curve
    Wavelength change measured by sensor FBG1
    Fig. 10. Wavelength change measured by sensor FBG1
    Relationship between peak-to-peak wavelength and cyclic loading times
    Fig. 11. Relationship between peak-to-peak wavelength and cyclic loading times
    Relationship between peak-to-peak wavelength and crack length
    Fig. 12. Relationship between peak-to-peak wavelength and crack length
    Tensile results of aluminum alloy sample 5
    Fig. 13. Tensile results of aluminum alloy sample 5
    Principle diagram of GBRT
    Fig. 14. Principle diagram of GBRT
    Principle of 5-fold cross-verification
    Fig. 15. Principle of 5-fold cross-verification
    Prediction result of GBRT algorithm
    Fig. 16. Prediction result of GBRT algorithm
    ParameterValue
    Density /(kg·m-3)2700
    Young’s modulus /MPa69
    Poisson’s ratio0.33
    Max principal stress /MPa84.4
    Coefficient of damage viscosity0.0001
    Table 1. Material properties of simulation experiment
    Number123456789
    Cycle /10403.03.54.04.55.05.56.06.1
    Crack length /mm02.22.63.14.46.27.813.321.0
    Table 2. Results of fatigue tensile test
    Evaluation indexSSEMAEMSER2
    Value0.08200.07130.03580.9912
    Table 3. Evaluation indexes of fitting curve
    Model01234
    GBRT-0.486222-0.279238-0.402655-0.632112-4.465716
    Table 4. 5-fold cross-validation results of GBRT model
    ModelEVMAEMSER2
    GBRT0.9999470.0186830.0006990.999935
    Table 5. Regression performance evaluation results of GBRT model
    ModelEVMAEMSER2
    Linear0.9997430.0342500.0027710.999743
    SVR0.9996700.0611970.0045680.999577
    GBRT0.9999470.0186830.0006990.999935
    Table 6. Regression performance evaluation results of model
    Lingyu Sun, Changchao Liu, Mingshun Jiang, Lei Zhang, Faye Zhang, Qingmei Sui, Lei Jia. Fatigue Crack Prediction Method for Aluminum Alloy Based on Fiber Bragg Grating Array[J]. Chinese Journal of Lasers, 2021, 48(13): 1306003
    Download Citation