
Lin Li, Chenliang Chang, Caojin Yuan, Shaotong Feng, Shouping Nie, Zhi-Cheng Ren, Hui-Tian Wang, Jianping Ding. High efficiency generation of tunable ellipse perfect vector beams[J]. Photonics Research, 2018, 6(12): 1116
- Photonics Research
- Vol. 6, Issue 12, 1116 (2018)
![Reconstructed results of the ellipse beams with different topological charges [l1=2 for (a) and (b), l2=4 for (c) and (d)]. (a) and (c) are the intensity distributions. (b) and (d) are the phase distributions with differently marked topological charges.](/richHtml/prj/2018/6/12/12001116/img_001.jpg)
Fig. 1. Reconstructed results of the ellipse beams with different topological charges [l 1 = 2 l 2 = 4
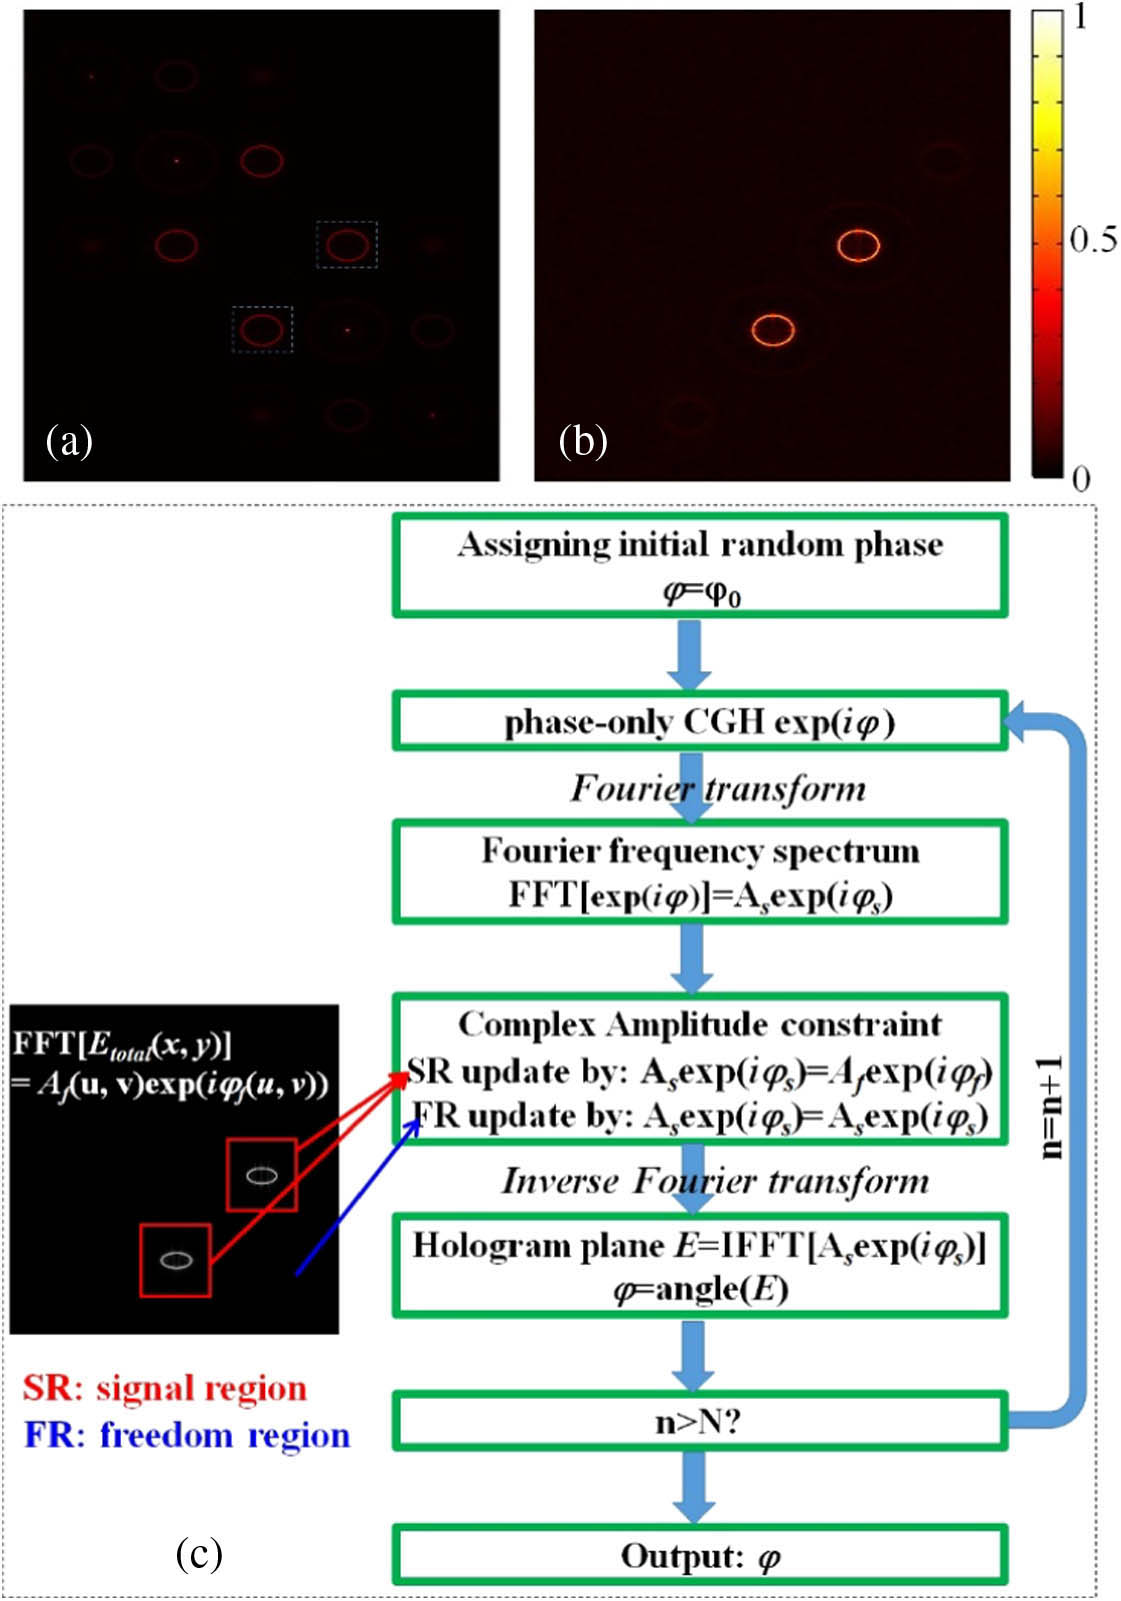
Fig. 2. Intensity distributions at the filtering (Fourier) plane from the phase-only CGH calculated by (a) the grating encoding method and (b) the proposed F-DCGS method. (c) Flow chart of the proposed F-DCGS algorithm.
Fig. 3. Schematic representation of the experiment setup for generating an EPVB. P, polarizer; BE, beam expander; SLM, spatial light modulator; L f 1 = 400 mm f 2 = 300 mm f 3 = 100 mm
Fig. 4. Generated intensity of the EPVB from the phase-only CGH calculated (a), (b) by the grating encoding method and (c), (d) by the F-DCGS method. The arrow marks in (b) and (d) indicate the polarization direction of an analyzer before the CCD.
Fig. 5. Experimental results of generating EPVBs under different ellipse modes and topological charges. The scaling factors are (a) a = 1 b = 0.5 a = 1 b = 0.75 a = 1 b = 1 a = 0.75 b = 1 a = 0.5 b = 1
Fig. 6. Experimental intensity profiles of generating hybrid EPVBs after two analyzer directions.
Fig. 7. Experimental intensity patterns of the generated RPVBs. (a)–(d): RPVBs under different scaling modes of (a = 1 b = 0.5 a = 1 b = 0.75 a = 0.75 b = 1 a = 0.5 b = 1
Fig. 8. Beam propagation in the x z y z 32 ]. (b) Our method. The beam intensity profiles before (z = − 1 cm z = 0 z = 0
Fig. 9. Experimental results of the generated hybrid EPVBs in two different types of three-dimensional layouts under different analyzer directions.

Set citation alerts for the article
Please enter your email address
© Copyright 2018-2021 | Chinese Laser Press. All Rights Reserved 沪ICP备15018463号-20