
Hu Yue, Liu Shasha, Cheng Xu, Liu Dong. Finite Element Simulation on Bending Properties of TA2/TA15 Gradient Material by Laser Direct Deposition[J]. Chinese Journal of Lasers, 2020, 47(12): 1202006
- Chinese Journal of Lasers
- Vol. 47, Issue 12, 1202006 (2020)
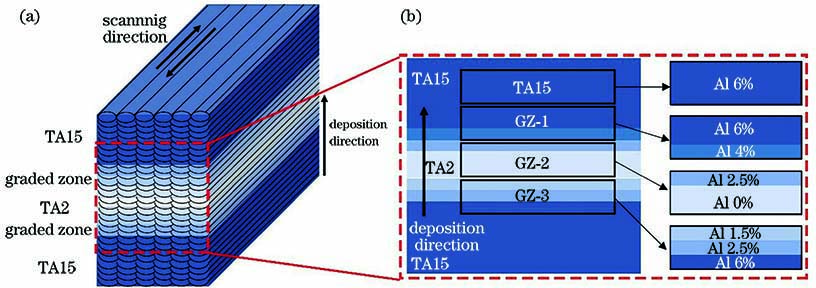
Fig. 1. Schematic of laser direct deposition process and sampling diagram for three-point bending experiment. (a) Schematic of multi-channel and multi-layer deposition; (b) sampling diagram for three-point bending experiment
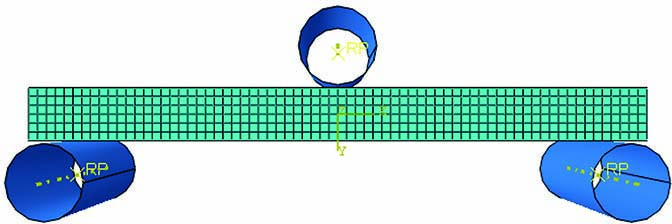
Fig. 2. Geometric model and meshing of three-point bending experiment in finite element simulation
Fig. 3. OM and SEM images of TA15 and TA2 zones of TA2/TA15 gradient materials. (a) TA15; (b) TA2
Fig. 4. OM and SEM images of transition zone of TA2/TA15 gradient material. (a) Macrostructure image of transition zone; (b)(c)(d) microstructures of different transition zones
Fig. 5. Microhardness of TA2/TA15 gradient materials with different Al contents
Fig. 6. Experimental result of three-point bending. (a) Macroscopic deformation of samples; (b) load-displacement curves of samples; (c) bending strength of specimens; (d) displacement of samples in bending failure
Fig. 7. SEM images of samples after failure during bending experiment. (a)(b) TA15 sample; (c) GZ-1 sample; (d) GZ-2 sample
Fig. 8. Images of crack propagation path of GZ-3 sample. (a) Bottom of crack propagation path; (b) beginning position of crack propagation path
Fig. 9. Stress field distribution diagrams of gradient materials obtained by finite element simulation when the maximum true strain in x direction is 0.005, 0.05, and 0.1. (a) TA15 model; (b) GZ-1 model; (c) GZ-2 model; (d) GZ-3 model
Fig. 10. Stress field distribution of gradient materials obtained by finite element simulation when the load is 200 N, 400 N, and 600 N. (a) TA15 model; (b) GZ-1 model; (c) GZ-2 model; (d) GZ-3 model
Fig. 11. Load-displacement curves of TA15 sample obtained by three-point bending test and finite element simulation
| |||||||||||||||||||||||||||||||||||||||||||||||
Table 1. Chemical composition of TA2 and TA15 alloys
|
Table 2. Tensile properties of as-deposited TA2, TA15 and TA2/TA15 gradient materials

Set citation alerts for the article
Please enter your email address
© Copyright 2018-2021 | Chinese Laser Press. All Rights Reserved 沪ICP备15018463号-20