
Renyue Dai, Zhijun Fang, Yongbin Gao. Unsupervised Monocular Depth Estimation by Fusing Dilated Convolutional Network and SLAM[J]. Laser & Optoelectronics Progress, 2020, 57(6): 061007
- Laser & Optoelectronics Progress
- Vol. 57, Issue 6, 061007 (2020)
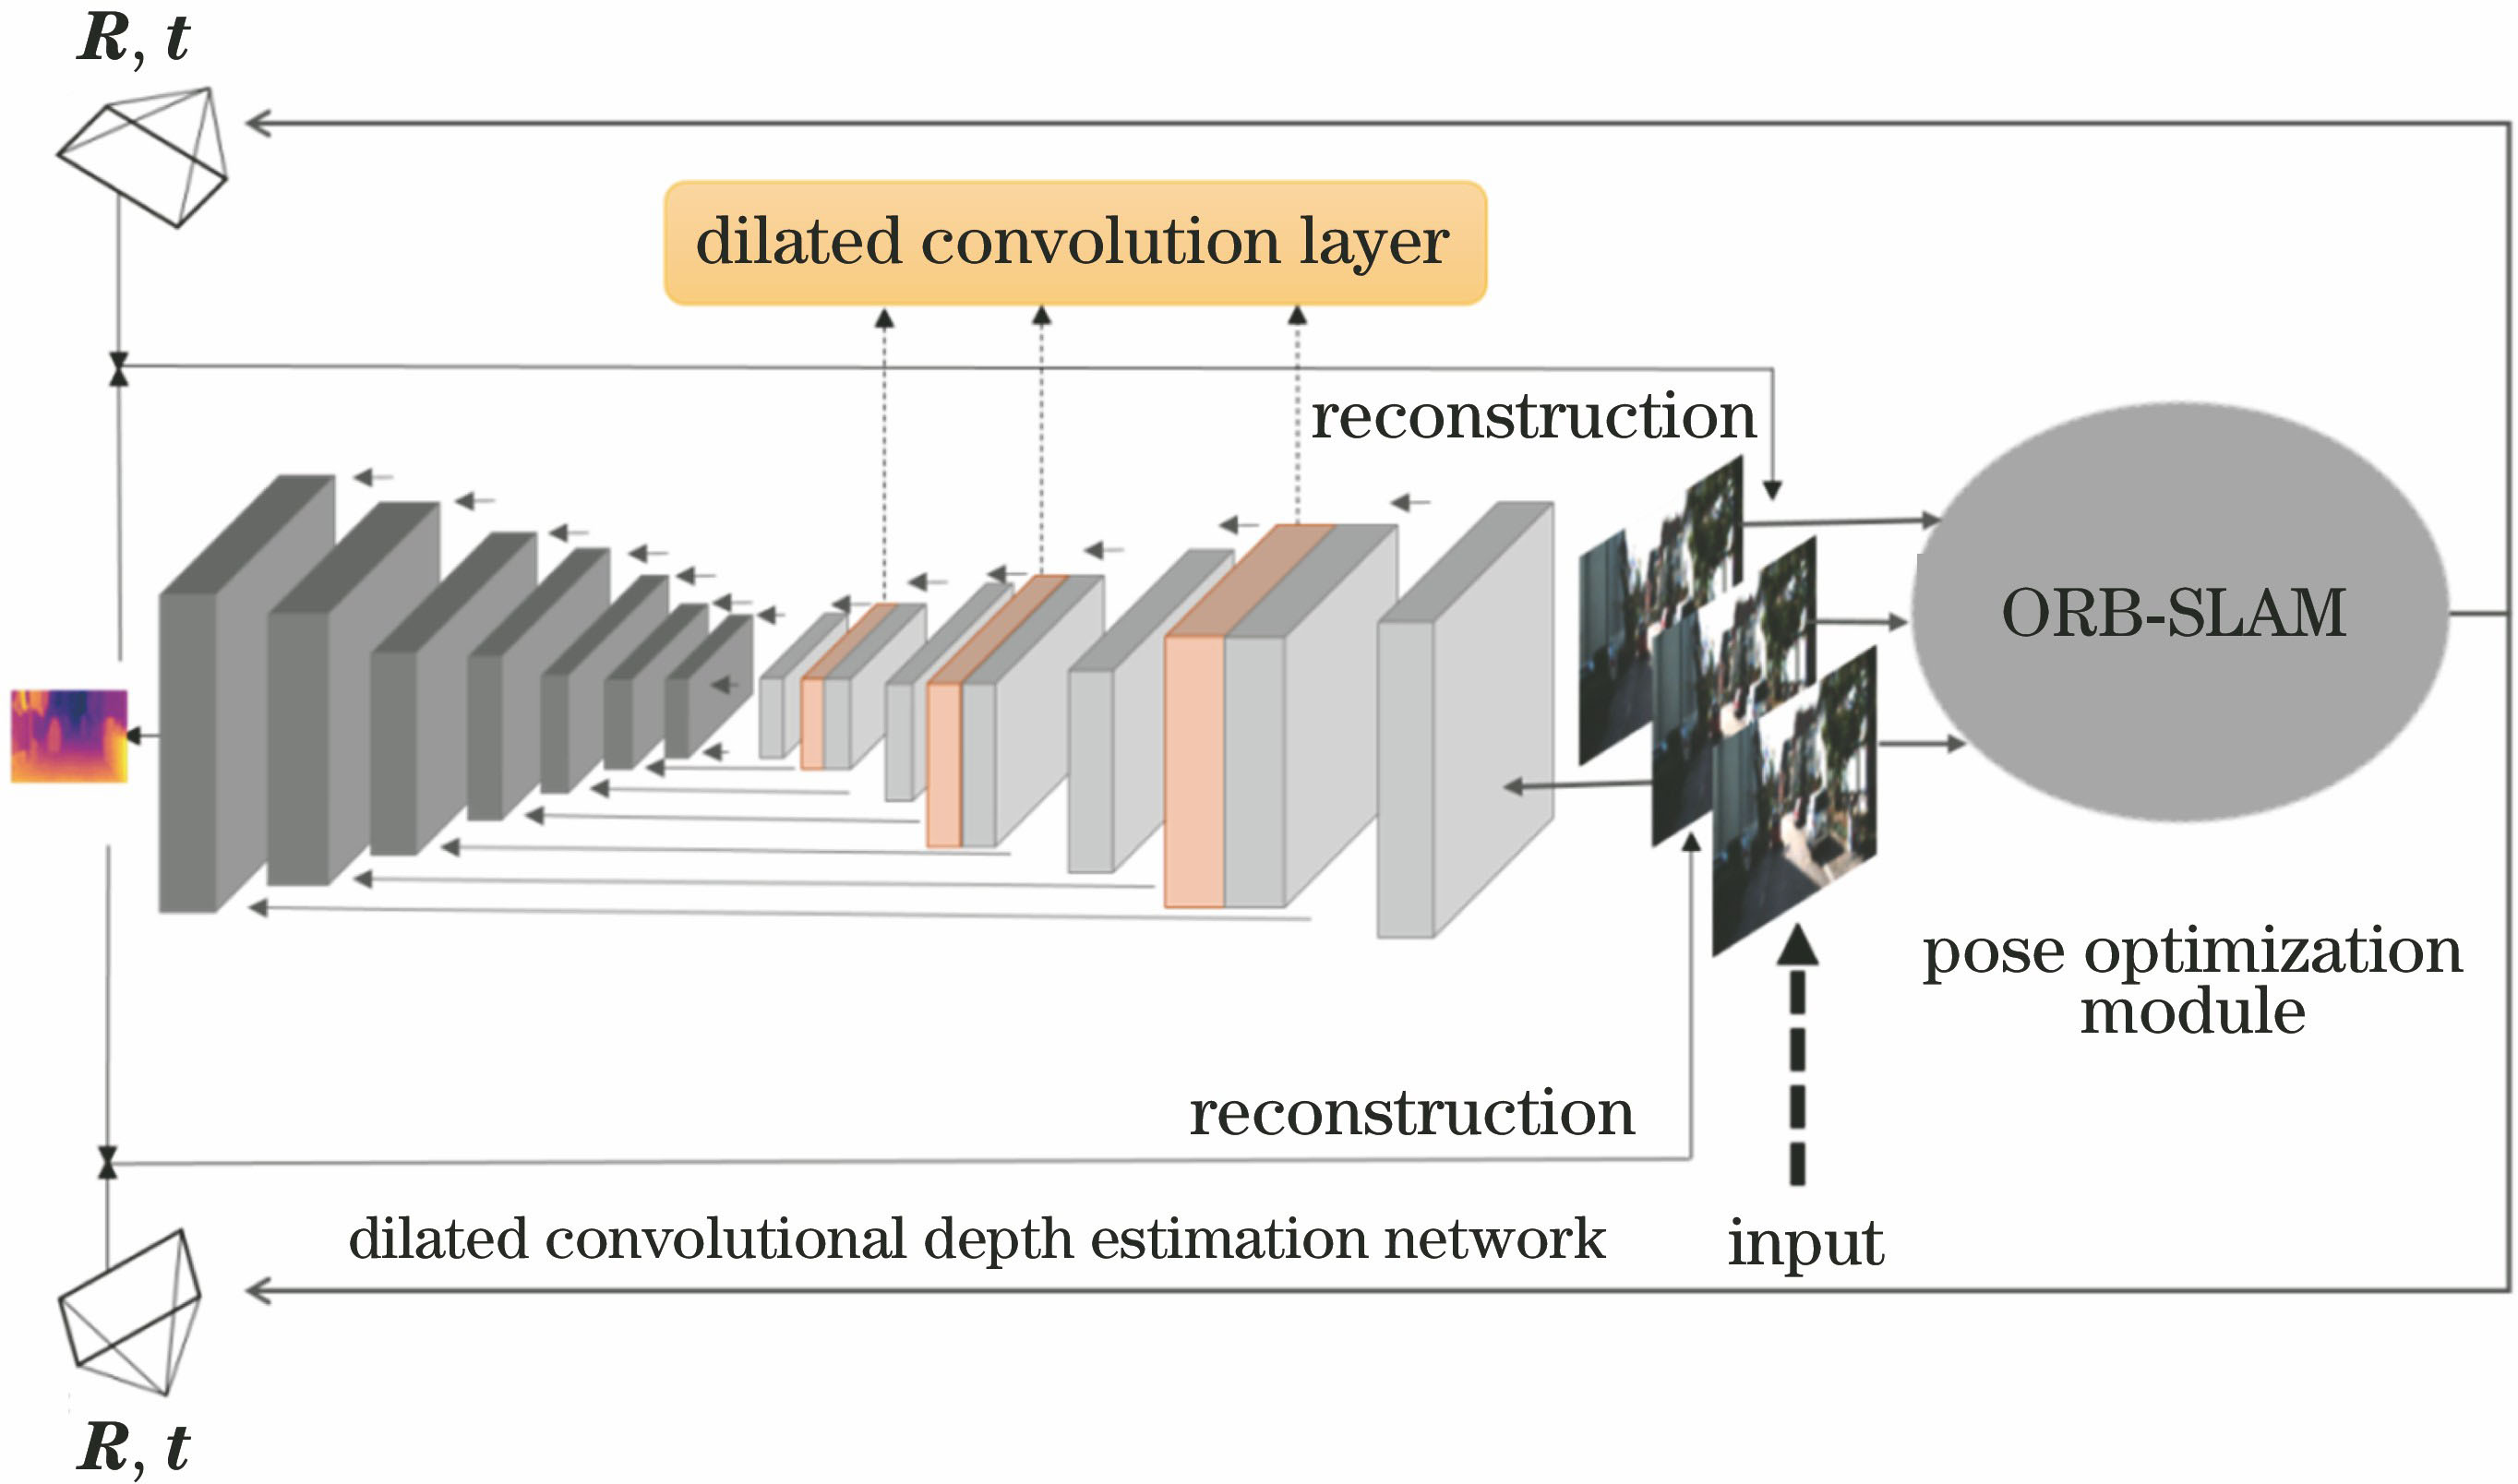
Fig. 1. Illustration of the network framework
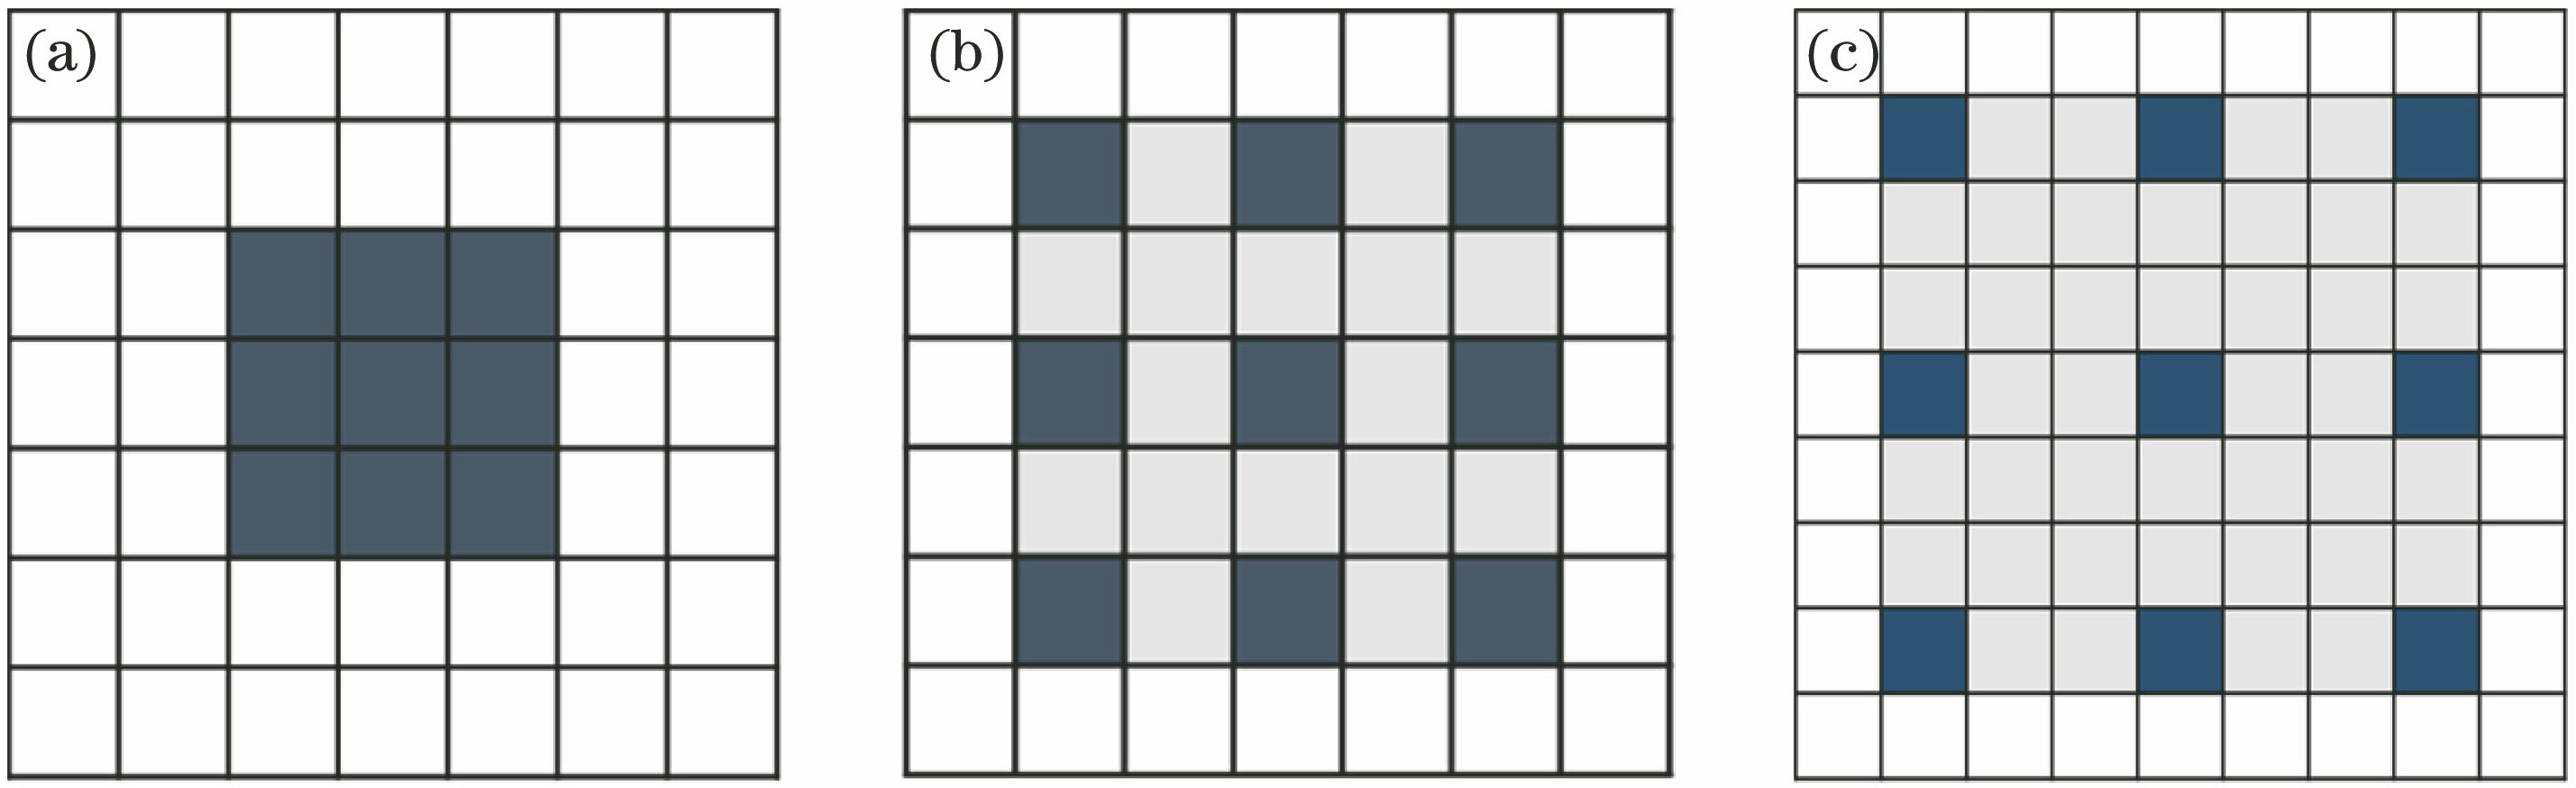
Fig. 2. Comparison of standard convolution and dilated convolution filters. (a) Standard convolution filter; (b) dilated convolution filter with dilation ratio of 2; (c) dilated convolution filter with dilation ratio of 3
Fig. 3. Visualization process comparison of dilated convolution and standard convolution. (a) Visualization process of standard convolution; (b) visualization process of dilated convolution with dilation ratio of 2; (c) visualization process of dilated convolution with dilation ratio of 3
Fig. 4. Flow chart of optimizing global camera pose by ORB-SLAM algorithm
Fig. 5. Projection process of three-dimensional space points onto the image plane
Fig. 6. Curves for different losses. (a) Reconstruction loss; (b) smooth loss; (c) total loss
Fig. 7. Camera pose trajectories for different sequences in the KITTI Odometry dataset. (a) 00; (b) 01; (c) 09; (d) 02; (e) 03; (f) 10
Fig. 8. Qualitative comparison of depth prediction. (a) RGB input image; (b) method of Garg et al.[11]; (c) sfmlearner method[4]; (d) our method; (e) ground truth
Fig. 9. Visualization comparison of depth details. (a)(c) Input images; (b)(d) output images
| |||||||||||||||||||||||||||||||||||||||
Table 1. RMSE comparison of 09 and 10 sequences in the KITTI Odometry dataset
| |||||||||||||||||||||||||||||||||||||||||||||||||||||||||||||||||||||||||||||||||||||||||||||||||
Table 2. Comparison of TUM evaluation results for depth estimation model

Set citation alerts for the article
Please enter your email address
© Copyright 2018-2021 | Chinese Laser Press. All Rights Reserved 沪ICP备15018463号-20