
Junlong Zhong, Jian Qiu, Kaiqing Luo, Rong Li, Li Peng, Dongmei Liu, Peng Han. Development of Linear Frequency Modulation Matched Filter Using Oversampling[J]. Laser & Optoelectronics Progress, 2020, 57(19): 190602
- Laser & Optoelectronics Progress
- Vol. 57, Issue 19, 190602 (2020)
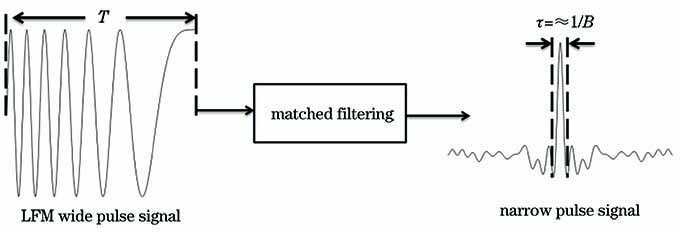
Fig. 1. Output waveform of LFM matched filtering
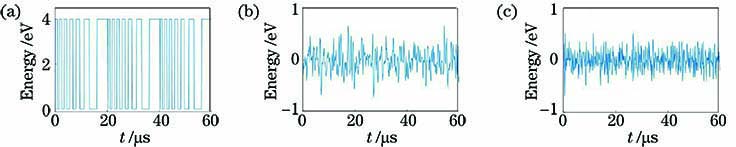
Fig. 2. Transmitting signal and receiving signal. (a) Transmitting signal of LFM pulse; (b) receiving signal at distance of 4 m; (c) receiving signal at distance of 6 m
Fig. 3. Output waveform of matched filter at different distances under sampling frequency of 10 MHz. (a) 4 m; (b) 6 m
Fig. 4. Output waveform of matched filter at different distances under sampling frequency of 50 MHz. (a) 4 m; (b) 6 m
Fig. 5. Design principle of orthogonal matched filter. (a) LFM matched filter; (b) orthogonal demodulation matched filter
Fig. 6. Flow chart of synchronous detection based on secondary decision
Fig. 7. Simulated waveform of demodulation output. (a) Output waveform of I/Q matched filtering; (b) secondary decision synchronous detection
Fig. 8. Output amplitude of matched filter under different clock frequency deviation
Fig. 9. Design structure of orthogonal matched filter. (a) Design structure of matched filter; (b) modules of orthogonal demodulation and test verification
Fig. 10. Schematic of experimental apparatus
Fig. 11. Output waveform of I/Q matched filter at different distances. (a) 4 m; (b) 6 m
Fig. 12. Actual test results at different distances. (a) 4 m; (c) 6 m
| ||||||||||||||||||||||||||||||||||||||||||||||||||||||||||||||||||||||||||||||||||||||||||||||||||||||||||||||||||||
Table 1. Errors are captured synchronously at different distancesunit: μs
| |||||||||||||||||||||||||||||||||||||||||||||||||||||||||||||
Table 2. Accuracy of synchronous detection at different sampling frequencies

Set citation alerts for the article
Please enter your email address
© Copyright 2018-2021 | Chinese Laser Press. All Rights Reserved 沪ICP备15018463号-20