• Chinese Journal of Lasers
  • Vol. 48, Issue 22, 2202020 (2021)
Liangliang Zhang1, Minjie Wang1、*, Jiaqi Zhang1, Jianye Liu2, Liuhui Niu2, and Jinhai Wang2
Author Affiliations
  • 1School of Mechanical Engineering, Dalian University of Technology, Dalian, Liaoning 116024, China
  • 2Guangdong Hanbang 3D Tech Co., Ltd., Zhongshan, Guangdong 528427, China
  • show less
    DOI: 10.3788/CJL202148.2202020 Cite this Article Set citation alerts
    Liangliang Zhang, Minjie Wang, Jiaqi Zhang, Jianye Liu, Liuhui Niu, Jinhai Wang. Effect of Defocus Distance on Formability of CX Maraging Stainless Steel by Selective Laser Melting[J]. Chinese Journal of Lasers, 2021, 48(22): 2202020 Copy Citation Text show less
    SEM morphology of CX stainless steel powder. (a) Low magnification 250×; (b) high magnification 1000×
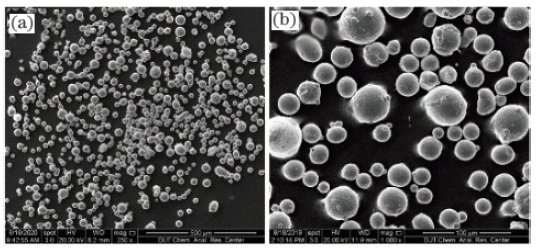
    Fig. 1. SEM morphology of CX stainless steel powder. (a) Low magnification 250×; (b) high magnification 1000×
    Schematic of scanning strategy
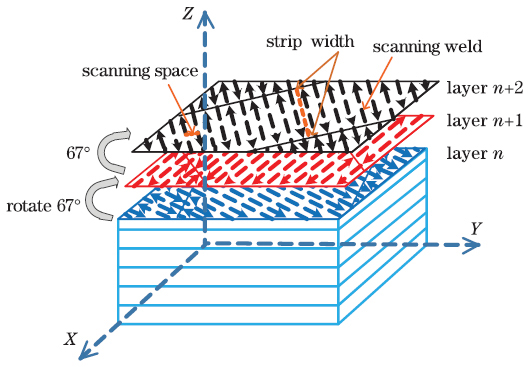
    Fig. 2. Schematic of scanning strategy
    Schematic of defocus distance
    Fig. 3. Schematic of defocus distance
    SLM process window of CX stainless steel
    Fig. 4. SLM process window of CX stainless steel
    Results of single weld channel test
    Fig. 5. Results of single weld channel test
    Optical micrographs of single weld channel section in stable melting zone Ⅱ. (a) P=200 W,V=1000 mm/s;(b) P=250 W,V=1100 mm/s;(c) P=350 W,V=1300 mm/s;(d) P=400 W,V=1400 mm/s;(e) P=300 W, V=1200 mm/s;(f) P=300 W,V=1100 mm/s;(g) P=300 W,V=1000 mm/s
    Fig. 6. Optical micrographs of single weld channel section in stable melting zone Ⅱ. (a) P=200 W,V=1000 mm/s;(b) P=250 W,V=1100 mm/s;(c) P=350 W,V=1300 mm/s;(d) P=400 W,V=1400 mm/s;(e) P=300 W, V=1200 mm/s;(f) P=300 W,V=1100 mm/s;(g) P=300 W,V=1000 mm/s
    Optical micrographs of single weld channel section in severe melting zone Ⅰ and incomplete melting zone Ⅲ. (a) P=300 W,V=900 mm/s;(b) P=350 W,V=1000 mm/s;(c) P=400 W,V=1000 mm/s;(d) P=200 W,V=1400 mm/s;(e) P=300 W,V=1500 mm/s;(f) P=400 W,V=1600 mm/s
    Fig. 7. Optical micrographs of single weld channel section in severe melting zone Ⅰ and incomplete melting zone Ⅲ. (a) P=300 W,V=900 mm/s;(b) P=350 W,V=1000 mm/s;(c) P=400 W,V=1000 mm/s;(d) P=200 W,V=1400 mm/s;(e) P=300 W,V=1500 mm/s;(f) P=400 W,V=1600 mm/s
    Density of samples under different defocus distances
    Fig. 8. Density of samples under different defocus distances
    Hardness of samples under different defocus distances
    Fig. 9. Hardness of samples under different defocus distances
    Optical micrographs of sample cross section under different defocus distances.(a) 0;(b) 1.5 mm; (c) 2.5 mm;(d) 3.5 mm;(e) 4.5 mm
    Fig. 10. Optical micrographs of sample cross section under different defocus distances.(a) 0;(b) 1.5 mm; (c) 2.5 mm;(d) 3.5 mm;(e) 4.5 mm
    Optical micrographs of sample longitudinal section under different defocus distances.(a) 0;(b) 1.5 mm; (c) 2.5 mm;(d) 3.5 mm;(e) 4.5 mm
    Fig. 11. Optical micrographs of sample longitudinal section under different defocus distances.(a) 0;(b) 1.5 mm; (c) 2.5 mm;(d) 3.5 mm;(e) 4.5 mm
    Surface roughness of samples under different defocus distances
    Fig. 12. Surface roughness of samples under different defocus distances
    SEM morphology of the sample surface under different defocus distances.(a) 0;(b) 1.5 mm;(c) 2.5 mm; (d) 3.5 mm;(e) 4.5 mm
    Fig. 13. SEM morphology of the sample surface under different defocus distances.(a) 0;(b) 1.5 mm;(c) 2.5 mm; (d) 3.5 mm;(e) 4.5 mm
    Metallographic corrosion morphology of sample cross sections under different defocus distances. (a) 0;(b) 1.5 mm;(c) 2.5 mm;(d) 3.5 mm;(e) 4.5 mm
    Fig. 14. Metallographic corrosion morphology of sample cross sections under different defocus distances. (a) 0;(b) 1.5 mm;(c) 2.5 mm;(d) 3.5 mm;(e) 4.5 mm
    Metallographic corrosion morphology of sample longitudinal sections under different defocus distances. (a) 0;(b) 1.5 mm;(c) 2.5 mm; (d) 3.5 mm;(e) 4.5 mm
    Fig. 15. Metallographic corrosion morphology of sample longitudinal sections under different defocus distances. (a) 0;(b) 1.5 mm;(c) 2.5 mm; (d) 3.5 mm;(e) 4.5 mm
    XRD spectra of samples under different defocus distances. (a) Diffraction angle 40°--90°; (b) diffraction angle 43.5°--45°
    Fig. 16. XRD spectra of samples under different defocus distances. (a) Diffraction angle 40°--90°; (b) diffraction angle 43.5°--45°
    Stress-strain curve in tensile test
    Fig. 17. Stress-strain curve in tensile test
    SEM morphology of tensile fracture under different defocus distances. (a) 0;(b) 1.5 mm;(c) 2.5 mm; (d) 3.5 mm;(e) 4.5 mm
    Fig. 18. SEM morphology of tensile fracture under different defocus distances. (a) 0;(b) 1.5 mm;(c) 2.5 mm; (d) 3.5 mm;(e) 4.5 mm
    XRD spectra of samples after heat treatment
    Fig. 19. XRD spectra of samples after heat treatment
    Metallographic morphology after heat treatment.(a)Solution;(b)aging;(c)solution aging
    Fig. 20. Metallographic morphology after heat treatment.(a)Solution;(b)aging;(c)solution aging
    SEM morphology after heat treatment.(a)Solution;(b)aging;(c)solution aging
    Fig. 21. SEM morphology after heat treatment.(a)Solution;(b)aging;(c)solution aging
    Result of the EDS analysis at marking position P1
    Fig. 22. Result of the EDS analysis at marking position P1
    Cross-section hardness after heat treatment
    Fig. 23. Cross-section hardness after heat treatment
    Longitudinal-section hardness after heat treatment
    Fig. 24. Longitudinal-section hardness after heat treatment
    Stress-strain curve in intensile test
    Fig. 25. Stress-strain curve in intensile test
    SEM morphology of tensile fracture.(a)Solution;(b)aging;(c)solution aging
    Fig. 26. SEM morphology of tensile fracture.(a)Solution;(b)aging;(c)solution aging
    High-magnification SEM morphology of tensile fracture.(a) Solution;(b) aging;(c) solution aging
    Fig. 27. High-magnification SEM morphology of tensile fracture.(a) Solution;(b) aging;(c) solution aging
    ElementCrNiMoAlMnSiCFe
    Mass fraction /%11.619.271.421.870.0660.0480.007Bal.
    Table 1. Chemical composition of CX stainless steel
    f /mmω /μmPd /(kW·mm-2)ωa /μmSpot diameter deviation /%
    08059.6875.29-5.89
    1.583.9854.1386.763.31
    2.590.6246.5194.414.18
    3.599.7638.38102.062.31
    4.5110.7831.12109.71-0.97
    Table 2. Spot diameter and energy density
    P,VLinear energy density E /(J·m-1)L/μmW/μmH/μmD/μm
    200 W, 1000 mm/s20087.55107.9057.1549.85
    250 W, 1100 mm/s22794.67124.6265.1565.47
    350 W, 1300 mm/s269109.12152.4877.38126.48
    400 W, 1400 mm/s286115.94156.2482.14144.04
    300 W, 1200 mm/s25098.43140.6193.2690.77
    300 W, 1100 mm/s273105.37147.7376.91121.01
    300 W, 1000 mm/s300118.65159.4271.32146.35
    Table 3. Single weld channel and molten pool size in stable melting zone Ⅱ
    Defocus distance /mmTensile strength /MPaYield strength /MPaElongation /%
    01128±9918±1512.24±0.36
    1.51141±5932±913.52±0.24
    2.51184±7993±617.13±0.28
    3.51218±51046±818.28±0.33
    4.51174±13954±516.48±0.45
    Table 4. Tensile test results under different defocus distances
    Heat treatmentTensile strength /MPaYield strength /MPaElongation /%
    Solution1102±8704±118.72±0.38
    Aging1678±31401±1512.04±0.52
    Solution aging1746±101489±276.36±0.79
    Table 5. Tensile test results after heat treatment
    Liangliang Zhang, Minjie Wang, Jiaqi Zhang, Jianye Liu, Liuhui Niu, Jinhai Wang. Effect of Defocus Distance on Formability of CX Maraging Stainless Steel by Selective Laser Melting[J]. Chinese Journal of Lasers, 2021, 48(22): 2202020
    Download Citation