
Xiaoming Li, Guibing Wang, Lizhong Zhang, Tianyu Wang, Tianshuo Zhang. Parametric design and test of flexible support for mirror of single trans optical terminal[J]. Infrared and Laser Engineering, 2020, 49(4): 0414003
- Infrared and Laser Engineering
- Vol. 49, Issue 4, 0414003 (2020)
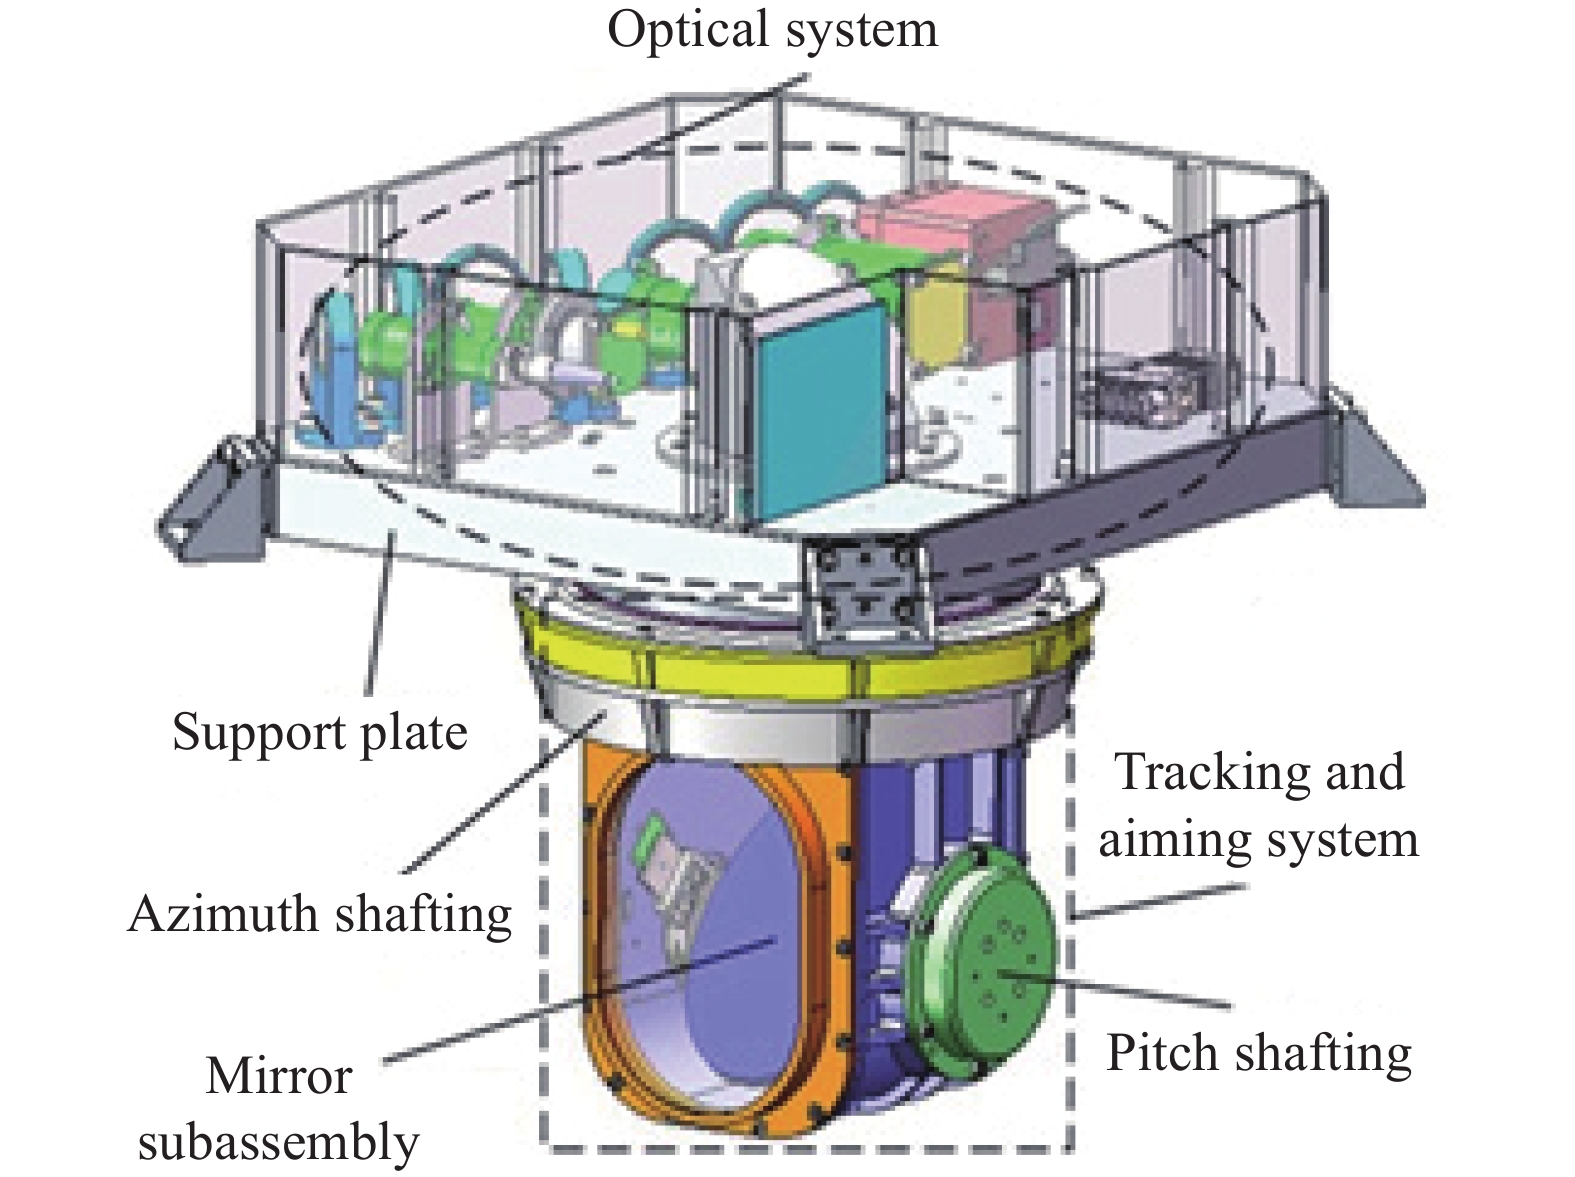
Fig. 1. Schematic diagram of laser communication terminal device
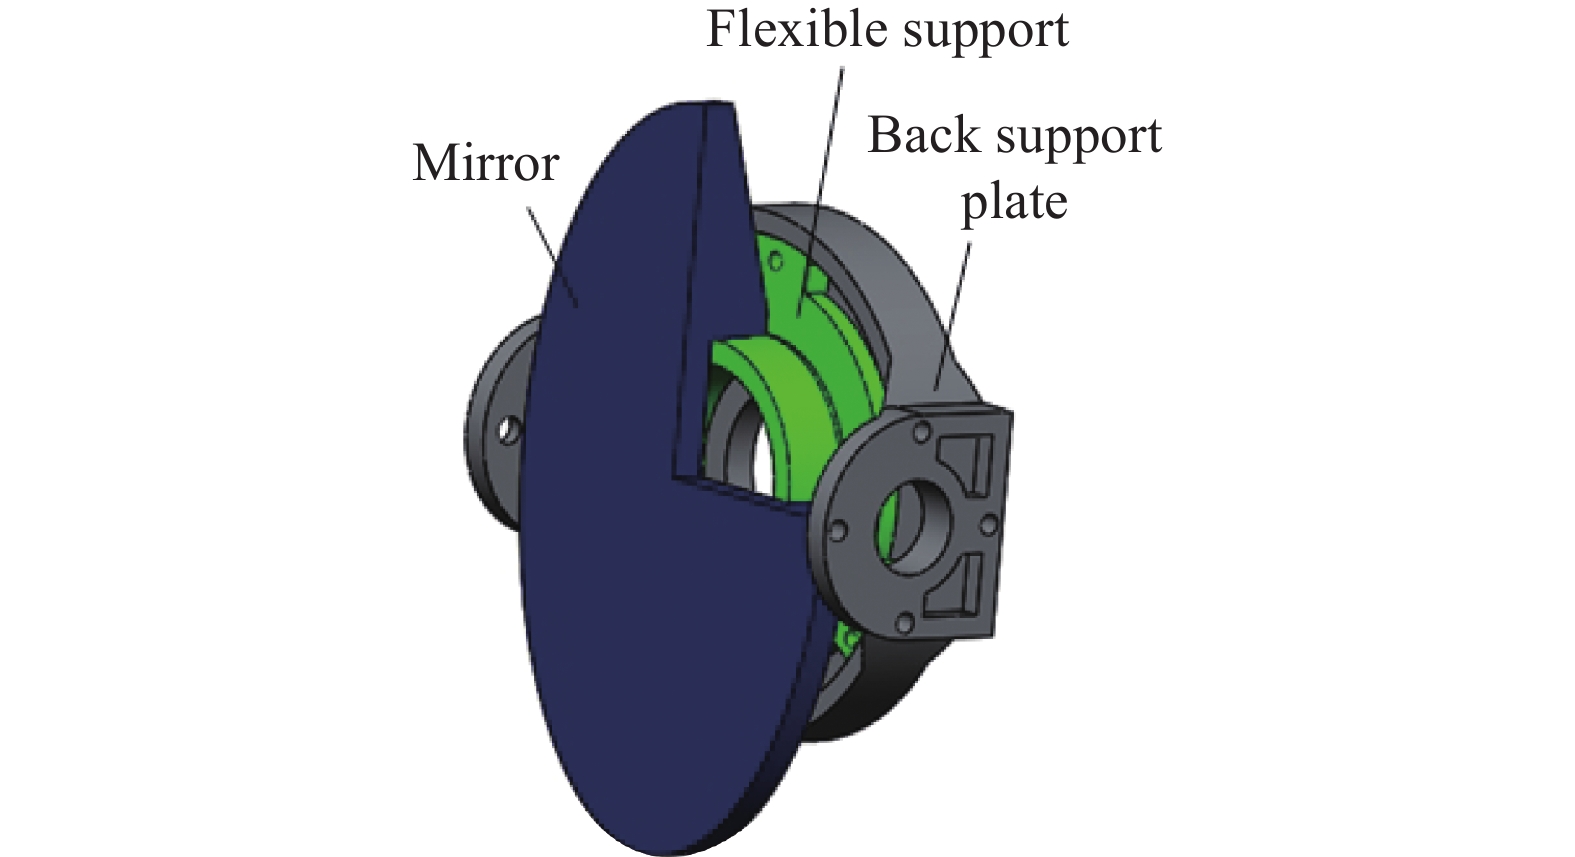
Fig. 2. Scheme of mirror subassembly
Fig. 3. Diagrams of two kinds of flexible support structure
Fig. 4. Main parameters of flexible support structure
Fig. 5. Relationship between the center angle of grooved circle θ , RMS of surface shape and dynamic stiffness of assembly
Fig. 6. Schematic diagram of flexible support structure
Fig. 7. Finite element model of mirror subassembly
Fig. 8. Modal analysis nephogram
Fig. 9. Mirror subassembly object and assembly drawing of the whole machine
Fig. 10. System for mirror subassembly surface shape testing
Fig. 11. Results of mirror subassembly surface shape testing at different temperatures
Fig. 12. Sweep sine response test site of mirror subassembly
Fig. 13. Sweep sine response curve under Z vibration
|
Table 1. Material properties of reflector components
| |||||||||||||||||||||||||||||||||||
Table 2. Level table of parameter factors for flexible support structures
|
Table 3. Orthogonal test scheme
|
Table 4. Range analysis of factors
|
Table 5. Results of modal analysis of mirror subassembly
| ||||||||||||||||||||||||||
Table 6. Analysis results of mirror surface error under 10 ℃ uniform temperature rise(reduction) and 1 g gravity(Unit: nm)
|
Table 7. Results of mirror subassembly surface shape testing(Unit: nm)

Set citation alerts for the article
Please enter your email address
© Copyright 2018-2021 | Chinese Laser Press. All Rights Reserved 沪ICP备15018463号-20