
Jiangwei WANG, Guangyu ZHANG, Chengqun YU. A Meta-analysis of the Effects of Organic and Inorganic Fertilizers on the Soil Microbial Community[J]. Journal of Resources and Ecology, 2020, 11(3): 298
- Journal of Resources and Ecology
- Vol. 11, Issue 3, 298 (2020)
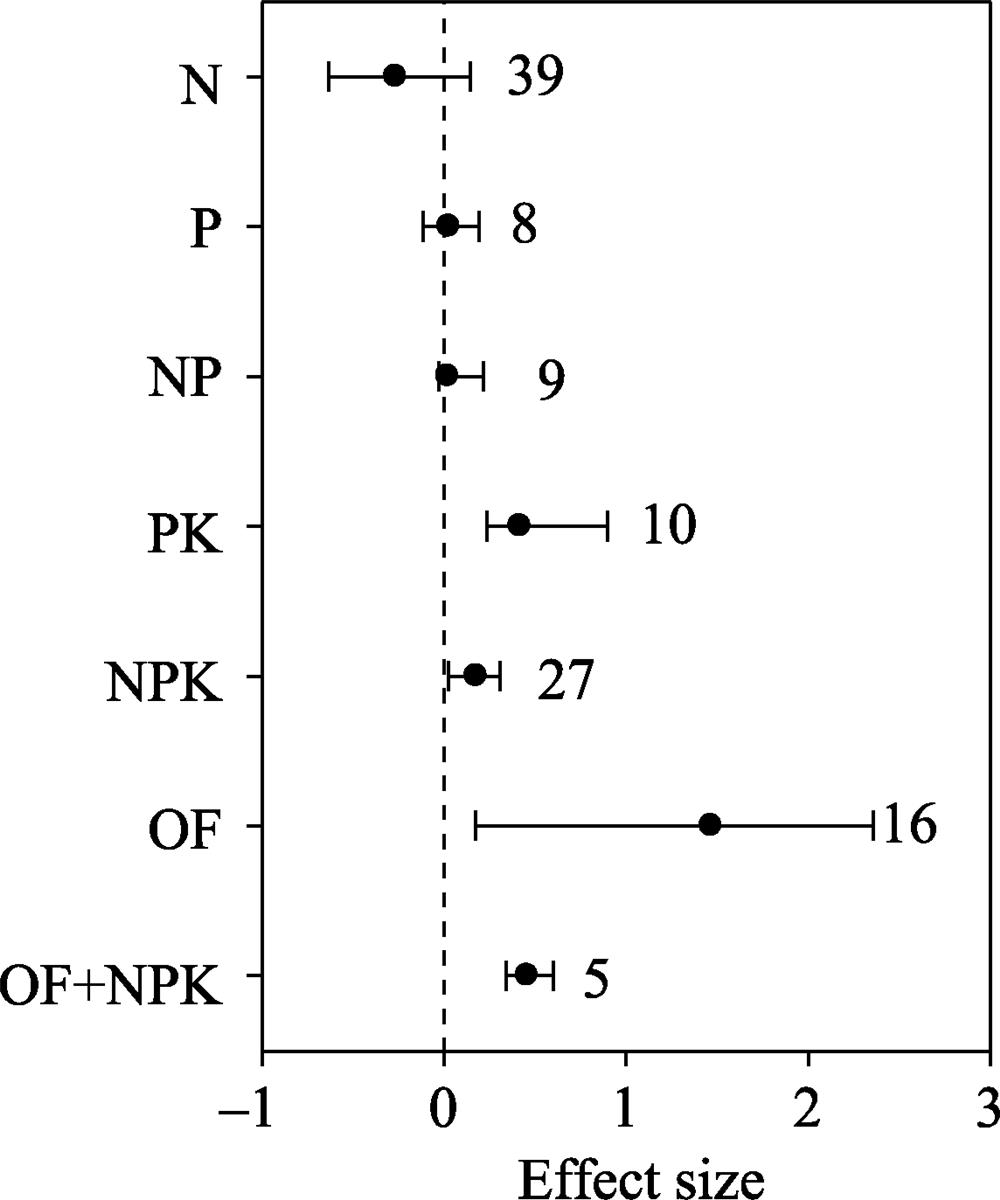
Fig. 1. Effect sizes of nitrogen (N), phosphorus (P), nitrogen+phosphorus (NP), phosphorus+potassium (PK), nitrogen+phosphorus+potassium (NPK), organic fertilizers (OF), and organic fertilizers + NPK (OF+NPK) on soil total PLFA. The error bars indicate effect sizes and 95% bootstrap confidence intervals. The effect was statistically significant if the 95%CI did not bracket zero. The dashed line is drawn at effect size = 0. The sample size for each variable is shown next to the bar.
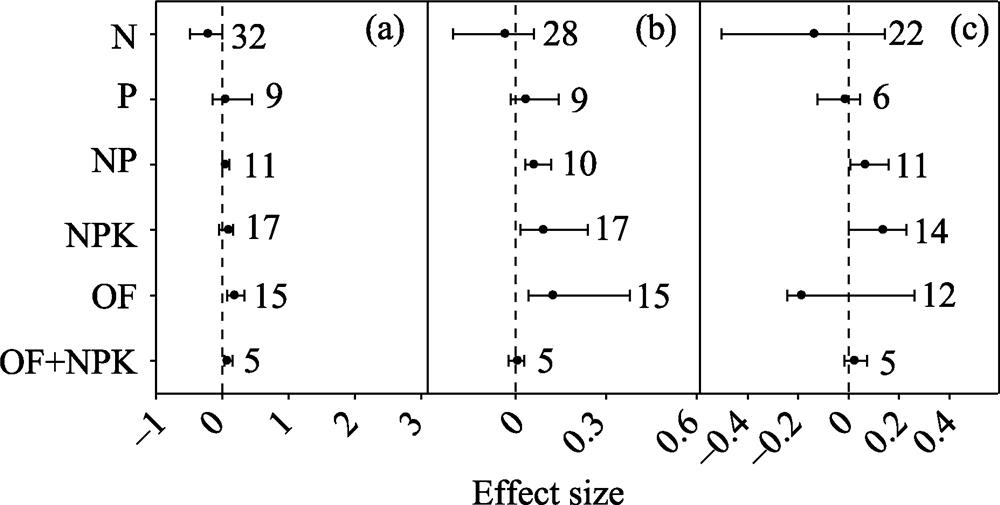
Fig. 2. Effect sizes of nitrogen (N), phosphorus (P), nitrogen+ phosphorus (NP), nitrogen+phosphorus+potassium (NPK), organic fertilizers (OF), and organic fertilizers+NPK (OF+ NPK) on soil (a) fungi, (b) bacteria and (c) actinomycetes. The error bars indicate effect sizes and 95% bootstrap confidence intervals. The effect was statistically significant if the 95%CI did not bracket zero. The dashed lines are drawn at effect size = 0. The sample size for each variable is shown next to the bar.
Fig. 3. Effect sizes of nitrogen (N), phosphorus (P), nitrogen+phosphorus (NP), nitrogen+phosphorus+potassium (NPK) and organic fertilizers (OF) on soil (a) gram-positive bacteria, and (b) gram-negative bacteria. The error bars indicate effect sizes and 95% bootstrap confidence intervals. The effect was statistically significant if the 95%CI did not bracket zero. The dashed lines are drawn at effect size = 0. The sample size for each variable is shown next to the bar.
Fig. 4. Effect sizes of nitrogen (N), phosphorus (P), nitrogen+phosphorus (NP), and nitrogen+phosphorus+potassium (NPK) on the ratio of soil fungi to bacteria (F/B ratio). The error bars indicate effect sizes and 95% bootstrap confidence intervals. The effect was statistically significant if the 95%CI did not bracket zero. The dashed line is drawn at effect size = 0. The sample size for each variable is shown next to the bar.
Fig. 5. Effect sizes of nitrogen (N) on PLFA, fungi, bacteria, actinomycetes, gram-positive bacteria (G+) and gram-negative bacteria (G-) in (a) forest (b) grassland and (c) cropland. The error bars indicate effect sizes and 95% bootstrap confidence intervals. The effect was statistically significant if the 95%CI did not bracket zero. The dashed lines are drawn at effect size = 0. The sample size for each variable is shown next to the bar.
Fig. 6. Effect sizes of (a) ammonium nitrate and (b) urea on PLFA, fungi, bacteria, actinomycetes, gram-positive bacteria (G+) and gram-negative bacteria (G-). The error bars indicate effect sizes and 95% bootstrap confidence intervals. The effect was statistically significant if the 95%CI did not bracket zero. The dashed lines are drawn at effect size = 0. The sample size for each variable is shown next to the bar.
| ||||||||||||||||||||||||||||||||||||||||||||||||||||||||||||||||||||||||||||||||||||||||||||||||||||||||||||||||||||||||||||||||||||||||||||||||||||||||||||||||||||||||||||||||||||||||||||||||||||||||||||||||||||||||||||||||||||||||||||||||||||||||||||||||||||||||||||||||||||||||||||||||||||||||||||||||||||||||||||||||||||||||||||||||||||||||||
Table 1.
Relationships between the effect sizes of nitrogen addition on microbial indicators (total PLFA, fungi, bacteria, actinomycetes, G+, G-, and F/B ratio), and experimental variables (latitude, longitude, MAT, MAP, nitrogen addition rate, nitrogen load, and nitrogen addition duration) based on a random effects model with a continuous variable meta- analysis.

Set citation alerts for the article
Please enter your email address
© Copyright 2018-2021 | Chinese Laser Press. All Rights Reserved 沪ICP备15018463号-20