1Lhasa Plateau Ecosystem Research Station, Key Laboratory of Ecosystem Network Observation and Modeling, Institute of Geographic Sciences and Natural Resources Research, Chinese Academy of Sciences, Beijing 100101, China
2University of Chinese Academy of Sciences, Beijing 100049, China
Jiangwei WANG, Guangyu ZHANG, Chengqun YU. A Meta-analysis of the Effects of Organic and Inorganic Fertilizers on the Soil Microbial Community[J]. Journal of Resources and Ecology, 2020, 11(3): 298
Copy Citation Text
In order to investigate the general tendency of soil microbial community responses to fertilizers, a meta-analysis approach was used to synthesise observations on the effects of inorganic and organic fertilizer addition (N: nitrogen; P: phosphorus; NP: nitrogen and phosphorus; PK: phosphorus and potassium; NPK: nitrogen, phosphorus and potassium; OF: organic fertilizer; OF+NPK: organic fertilizer plus NPK) on soil microbial communities. Among the various studies, PK, NPK, OF and OF+NPK addition increased total phospholipid fatty acid (PLFA) by 52.0%, 19.5%, 334.3% and 58.3%, respectively; while NP, OF and OF+NPK addition increased fungi by 5.6%, 21.0% and 8.2%, respectively. NP, NPK and OF addition increased bacteria by 6.4%, 9.8% and 13.3%, respectively; while NP and NPK addition increased actinomycetes by 7.0% and 14.8%, respectively. Addition of ammonium nitrate rather than urea decreased gram-negative bacteria (G -). N addition increased total PLFA、bacteria and actinomycetes in croplands, but decreased fungi and bacteria in forests, and the F/B ratio in grasslands. NPK addition increased total PLFA in forests but not in croplands. The N addition rate was positively correlated with the effects of N addition on gram-positive bacteria (G +) and G -. Therefore, different fertilizers appear to have different effects on the soil microbial community. Organic fertilizers can have a greater positive effect on the soil microbial community than inorganic fertilizers. The effects of fertilizers on the soil microbial community varied with ecosystem types. The effect of N addition on the soil microbial community was related to both the forms of nitrogen that were added and the nitrogen addition rate.
Considering that soil microbes mediate many key biogeochemical processes in carbon and nitrogen cycling, they are central to the overall ecosystem function (Crowther et al., 2012; Zhang et al., 2015; Fu and Shen, 2017b). Microorganisms are important media for nutrient retention and transformation of soil nitrogen and phosphorus, and they can reveal soil functions related to nutrient cycling (Moscatelli et al., 2005; Joergensen and Emmerling, 2010; Fu et al., 2012a). Fertilization, as an important method of human land management, can be divided into organic manure application and inorganic fertilizer application. The complexity of the soil microbial community and the many ways that it can be affected by climate and other global changes can interfere with the metabolic activity of organisms in different ways (Bardgett et al., 2008; Fu et al., 2012b; Fu et al., 2019a). Thus, the knowledge of soil microbial ecology can provide a better understanding of the terrestrial carbon cycle, and climate may play a vital role in the balanced ecosystem.
Field experiments have analysed the potential effects of inorganic and organic fertilizers on the soil microbial community. However, some issues still needed to be further resolved. First, there are inconsistent results reported in various studies. For example, several studies have demonstrated that long-term use of nitrogen fertilizer will adversely affect soil microbes (Lovell et al., 1995). Organic fertilizer application is beneficial for increasing the G+/G- ratio, and it promotes bacterial growth (Yeates et al., 1997). Second, most previous meta-analyses in this area have mainly focused on the effects of nitrogen addition on plants and soils, rather than on the soil microbial community (Fu and Shen, 2017c). Third, no meta-analysis has compared the effects of various forms of fertilizers (nitrogen, phosphorus, potassium and organic fertilizers) on the soil microbial community (Fu and Shen, 2016).
Therefore, in this study, we compiled data from published studies related to the effects of fertilizers on the soil microbial community which were derived from PLFA measurements. The main objectives were to (1) examine the general quantitative effects of inorganic and organic fertilizers on 10 variables related to the soil microbial community; (2) determine whether environmental factors and/or vegetation types can affect the responses of the soil microbial community to fertilizers; and (3) determine whether the responses of the soil microbial community to fertilizers varied with the different forms of fertilizers that were tested.
2 Materials and methods
2.1 Data compilation
We sought papers and theses published prior to 2015 using the Web of Science and the China National Knowledge Infrastructure. The compiled database included measurements of soil total PLFA, fungi, bacteria, gram-positive bacteria (G+), gram-negative bacteria (G-), actinomycetes, the ratio of soil fungi to bacteria (F/B ratio) and the ratio of gram-positive to gram-negative bacteria (G+/G- ratio).
Similar to many meta-analyses (Fu and Shen, 2017a), our criteria for including studies were as follows: at least one of the variables mentioned above was measured; only field inorganic and organic fertilizer experimental studies were included; only data from controls and treatments were used for multifactor experiments; only the most recent results were used among multiple observations at different times from the same study site; means, standard deviations (or standard errors), and sample sizes were directly provided or could be calculated from the other data presented in the studies.
Considering that temperature, precipitation and vegetation types are important environmental factors (Fu et al., 2011; Wang et al., 2015; Wu and Fu, 2018; Fu et al., 2019c), data on the latitude, longitude, mean annual temperature, mean annual precipitation, nitrogen addition rate, nitrogen load and nitrogen duration were also extracted. We separately grouped all of the studies into those analysing forests, grasslands, croplands and tundra ecosystems. The data were extracted using the GetData software when studies provided the data in graphic figures (Fu et al., 2015).
2.2 Statistical analyses
The METAWIN 2.1 software (Sinauer Associates Inc., Sunderland, MA, USA) (Rosenberg et al., 2000) was used to perform the meta-analysis in this study. The natural logarithm of the response ratio (R) was used as the effect size (Hedges et al., 1999),
where$S_{c}^{2}$and $S_{t}^{2}$ are the standard deviations of the control and experimental treatments, respectively; and ${{n}_{c}}$and${{n}_{t}}$are the sample sizes of the control and experimental treatments, respectively.
Therefore, the mean effect sizes ($\overline{\ln \text{ }R}$) for all observations were obtained,
where wi and $\ln \text{ }{{R}_{i}}$are w and lnR of the ith observation, respectively.
We used a fixed effects model, which is the simplest data structure model for a meta-analysis, to test whether a treatment had a significant effect on each variable across all studies (Rosenberg et al., 2000). The mean effect size and 95% bootstrap confidence intervals (CI) were generated. For each variable, the effect of the treatment on this variable is statistically significant if the 95% bootstrap CI does not cover zero (Fu et al., 2019b).
A fixed effects model with a grouping variable was used to compare the responses among vegetation types and forms of nitrogen fertilizers, which is analogous to ANOVA (Rosenberg et al., 2000). In the grouping models, the mean effect size of each group can be calculated using only the observations of that group (Rosenberg et al., 2000). Similarly, the effect of a treatment is statistically significant if the 95% bootstrap CI for each group does not cover zero
(Rosenberg et al., 2000).
A random effects model with a continuous variable (【-逻*辑*与-】gt; 20 observations) was used to examine the relationships between the mean effect size of nitrogen addition and latitude, longitude, mean annual temperature, mean annual precipitation, nitrogen addition rate (kg N hm2 yr-1), nitrogen load (kg N hm2) and nitrogen addition duration (Rosenberg et al., 2000). A significant regression coefficient (i.e., slope) indicates that a significant amount of the variation between the effect sizes can be explained by an independent variable (Rosenberg et al., 2000).
For grouping and continuous models, the total heterogeneity (QT) of the effect sizes can be partitioned into the variation among the effect sizes which is explained by the model (QM) and the variation which is not explained by the model (QE) (Rosenberg et al., 2000). For a grouping model, a significant QM indicates that significant differences in the mean effect sizes are found among the groups, while for a continuous model, a significant QM indicates that a significant part of the variation among effect sizes can be explained by an independent variable (Rosenberg et al., 2000). All graphs were implemented using SigmaPlot 10.0 mapping software.
3 Results
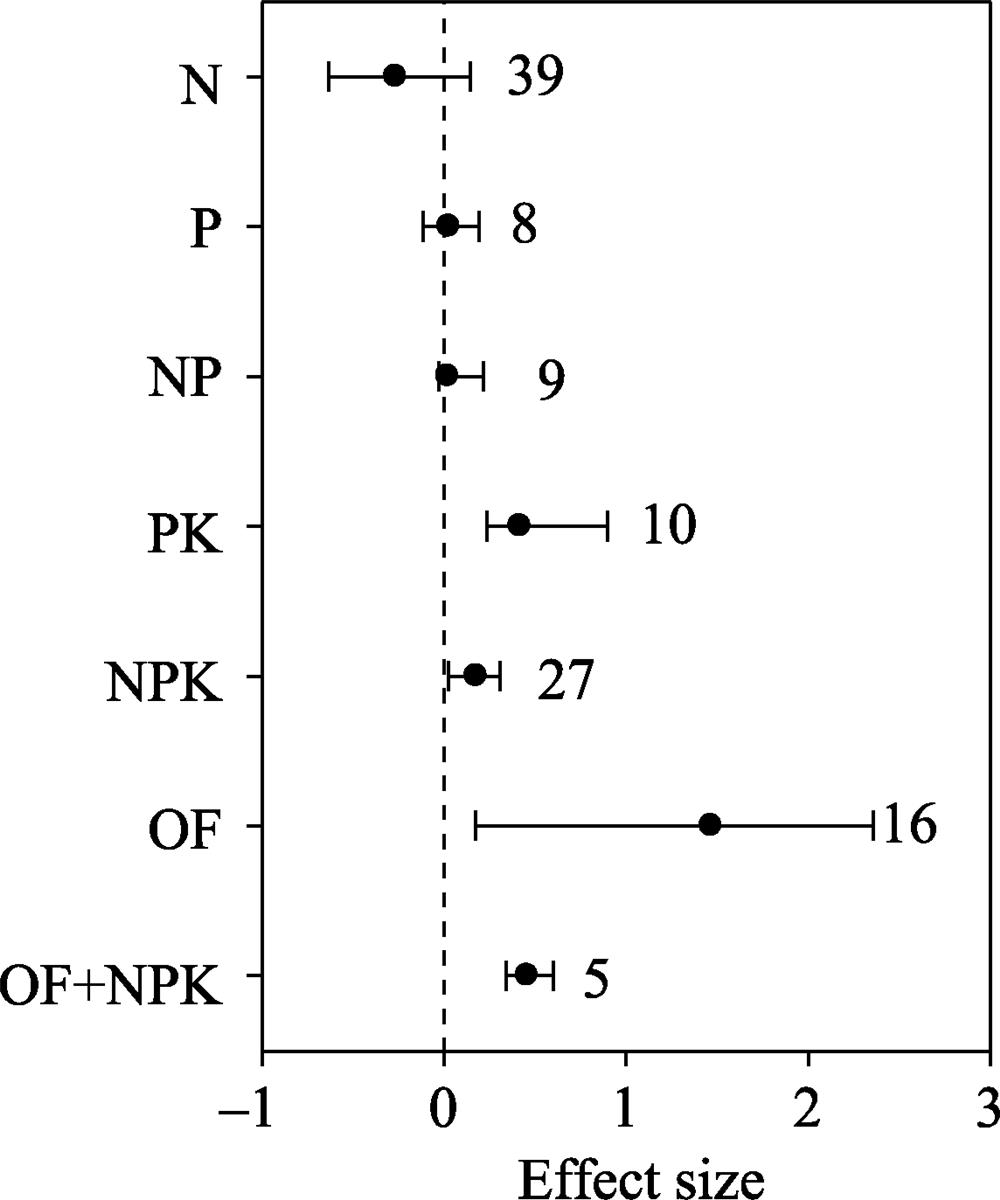
There were significant differences in the effects of fertilizers on total PLFA among the N(nitrogen), P(phosphorus), NP(nitrogen and phosphorus), PK(phosphorus and potassium), NPK(nitrogen, phosphorus and potassium), OF(organic fertilizer) and OF+NPK(organic fertilizer plus NPK) additions (QM = 6562.77, P 【-逻*辑*与-】lt; 0.001). The PK, NPK, OF and OF+NPK additions significantly increased total PLFA by 52.0%, 19.5%, 334.3% and 58.3%, respectively (Fig. 1).
Figure 1.
Effect sizes of nitrogen (N), phosphorus (P), nitrogen+phosphorus (NP), phosphorus+potassium (PK), nitrogen+phosphorus+potassium (NPK), organic fertilizers (OF), and organic fertilizers + NPK (OF+NPK) on soil total PLFA. The error bars indicate effect sizes and 95% bootstrap confidence intervals. The effect was statistically significant if the 95%CI did not bracket zero. The dashed line is drawn at effect size = 0. The sample size for each variable is shown next to the bar.
There were significant differences in the effects of fertilizers on fungi (QM = 320.00, P 【-逻*辑*与-】lt; 0.001), bacteria (QM = 170.51, P 【-逻*辑*与-】lt; 0.001) and actinomycetes (QM = 217.51, P 【-逻*辑*与-】lt; 0.001) among the N, P, NP, NPK, OF and OF+NPK additions. NP, OF and OF+NPK addition increased fungi by 5.6%, 21.0% and 8.2%, respectively (Fig. 2a). NP, NPK and OF addition increased bacteria by 6.4%, 9.8% and 13.3%, respectively (Fig. 2b). NP and NPK addition increased actinomycetes by 7.0% and 14.8%, respectively (Fig. 2c).
Latitude, longitude, MAT, MAP, Nitrogen load, and Nitrogen duration were not correlated with fertilizers for soil PLFA, fungi, bacteria, G+, or G-. The nitrogen addition rate was positively correlated with fertilizers for gram-positive bacteria (G+), and gram-negative bacteria (G-) (Table 1).
There were significant differences in the effects of fertilizers on G+ (QM = 131.99, P 【-逻*辑*与-】lt; 0.001) and G- (QM = 87.50, P 【-逻*辑*与-】lt; 0.001) among the N, P, NP, NPK and OF additions. OF addition increased G- by 23.5% (Fig. 3). There were also significant differences in the effects of fertilizers on the F/B ratio (QM = 51.94, P 【-逻*辑*与-】lt; 0.001) among the N, P, NP and NPK additions. P addition increased the F/B ratio by 9.7%, while NPK addition decreased the F/B ratio by 9.2% (Fig. 4). N addition increased the G+/G- ratio by 6.5% (95% CI: 0.6%-59.5%).
N addition increased total PLFA by 24.4% and actinomycetes by 5.8% in croplands, decreased fungi by 37.1% and G- by 16.4% in forests, and decreased the F/B ratio by 14.3% in grasslands (Fig. 5). N addition increased bacteria by 8.6% in croplands, but decreased bacteria by 11.8% in forests (Fig. 5). NPK addition increased total PLFA in forests by 32.7% (95% CI: 9.9%-83.6%) but not in croplands (95% CI: -1.4% to 40.8%).
Ammonium nitrate addition decreased G- by 16.9% (Fig. 6). The nitrogen addition rate was positively correlated with the effects of nitrogen addition on G+ and G- (Table 1).
Figure 2.
Effect sizes of nitrogen (N), phosphorus (P), nitrogen+ phosphorus (NP), nitrogen+phosphorus+potassium (NPK), organic fertilizers (OF), and organic fertilizers+NPK (OF+ NPK) on soil (a) fungi, (b) bacteria and (c) actinomycetes. The error bars indicate effect sizes and 95% bootstrap confidence intervals. The effect was statistically significant if the 95%CI did not bracket zero. The dashed lines are drawn at effect size = 0. The sample size for each variable is shown next to the bar.
Effect sizes of nitrogen (N), phosphorus (P), nitrogen+phosphorus (NP), nitrogen+phosphorus+potassium (NPK) and organic fertilizers (OF) on soil (a) gram-positive bacteria, and (b) gram-negative bacteria. The error bars indicate effect sizes and 95% bootstrap confidence intervals. The effect was statistically significant if the 95%CI did not bracket zero. The dashed lines are drawn at effect size = 0. The sample size for each variable is shown next to the bar.
Effect sizes of nitrogen (N), phosphorus (P), nitrogen+phosphorus (NP), and nitrogen+phosphorus+potassium (NPK) on the ratio of soil fungi to bacteria (F/B ratio). The error bars indicate effect sizes and 95% bootstrap confidence intervals. The effect was statistically significant if the 95%CI did not bracket zero. The dashed line is drawn at effect size = 0. The sample size for each variable is shown next to the bar.
Effect sizes of nitrogen (N) on PLFA, fungi, bacteria, actinomycetes, gram-positive bacteria (G<sup>+</sup>) and gram-negative bacteria (G<sup>-</sup>) in (a) forest (b) grassland and (c) cropland. The error bars indicate effect sizes and 95% bootstrap confidence intervals. The effect was statistically significant if the 95%CI did not bracket zero. The dashed lines are drawn at effect size = 0. The sample size for each variable is shown next to the bar.
Effect sizes of (a) ammonium nitrate and (b) urea on PLFA, fungi, bacteria, actinomycetes, gram-positive bacteria (G<sup>+</sup>) and gram-negative bacteria (G<sup>-</sup>). The error bars indicate effect sizes and 95% bootstrap confidence intervals. The effect was statistically significant if the 95%CI did not bracket zero. The dashed lines are drawn at effect size = 0. The sample size for each variable is shown next to the bar.
Nitrogen addition did not affect soil total PLFA or fungi, which was in line with a previous meta-analysis (Treseder, 2008). However, our finding was not in line with other findings of that study (Treseder, 2008) which found that nitrogen addition increased bacteria. While many bacteria feed on easily available C compounds, fungi seem to prefer more complex C compounds (Meidute et al., 2008). The differences in the findings between these two studies may be due to the fact that more nitrogen addition studies were included in our analysis. Organic fertilizer and single application P treatments significantly promoted fungal and bacterial growth and increased the fungal/bacterial ratio, while single applications of N had no significant effect on bacteria or fungi (Bai et al., 2008).
In this study, organic fertilizer addition had stronger positive effects on soil total PLFA, fungi, bacteria and gram- negative bacteria than inorganic fertilizer addition. In contrast, NP and NPK additions had stronger positive effects on actinomycetes than organic fertilizer addition. These results demonstrated that organic and inorganic fertilizers may have different effects on the soil microbial community. Organic fertilizers may not only provide a greater diversity of substrates than inorganic fertilizers for microbial activity but they also directly introduce microorganisms which occur naturally in the organic fertilizers into the soil (Zeng et al., 2007; Dong et al., 2014).
The different effects among OF, NPK and OF+NPK additions on soil total PLFA, fungi, bacteria and actinomycetes implied that inorganic fertilizer addition may dampen the positive effects of organic fertilizer addition on soil total PLFA, fungi and bacteria; while organic fertilizer addition may dampen the positive effect of inorganic fertilizer on actinomycetes. These results implied that there may be an antagonistic effect between organic and inorganic fertilizers on the soil microbial community.
Variables
Slope
P
n
Latitude
PLFA
0.012
0.155
34
Fungi
0.007
0.575
30
Bacteria
0.006
0.477
26
G-
-0.003
0.812
22
Longitude
PLFA
-0.002
0.090
34
Fungi
-0.001
0.492
30
Bacteria
-0.001
0.466
26
G-
-0.0010
0.439
22
MAT
PLFA
0.018
0.183
23
Fungi
0.018
0.296
22
MAP
PLFA
0.000
0.531
28
Fungi
0.000
0.885
27
Bacteria
0.000
0.907
23
G-
0.000
0.361
21
Nitrogen addition rate
PLFA
0.001
0.153
31
Fungi
0.001
0.090
32
Bacteria
0.001
0.051
28
Actinomycetes
0.001
0.392
22
G+
0.002
0.015
22
G-
0.002
0.001
24
F/B ratio
0.000
0.513
21
Nitrogen load
Fungi
0.000
0.425
21
Nitrogen duration
PLFA
-0.0001
0.906
30
Fungi
0.0002
0.841
26
Bacteria
0.0005
0.524
22
G-
0.0006
0.434
21
Table 1.
Relationships between the effect sizes of nitrogen addition on microbial indicators (total PLFA, fungi, bacteria, actinomycetes, G+, G-, and F/B ratio), and experimental variables (latitude, longitude, MAT, MAP, nitrogen addition rate, nitrogen load, and nitrogen addition duration) based on a random effects model with a continuous variable meta- analysis.
NPK addition had stronger effects on soil total PLFA, bacteria and actinomycetes than N, P and NP additions. PK addition had a stronger effect on soil total PLFA than N, P, NP and NPK additions. P addition increased the F/B ratio, while NPK addition decreased the F/B ratio. These results indicated that there may be interactive effects between N, P and K fertilizers on the soil microbial community, as different nitrogen, phosphorus, and potassium combinations produce different effects.
In our study, the effect of nitrogen addition on the soil microbial community varied among the different forms of nitrogen (Fig. 6). This finding may be due to several reasons. Firstly, soil microbial growth can be limited by both carbon and nitrogen availability (Li et al., 2012; Bai et al., 2013; Yu et al., 2019). Urea addition not only increases soil nitrogen availability, but it also contributes carbon into soil (Fu and Shen, 2016; Fu and Shen, 2017c). In contrast, ammonium can decrease fungal abundance, whereas nitrate mainly influences bacterial growth rates (Naoise et al., 2006; Birgander et al., 2014). Secondly, N addition affects soil microbial communities in both direct (physiological activity) and indirect (substrate supply) ways (Zak et al., 2011).
5 Conclusions
In summary, organic and inorganic fertilizers may have different effects on the soil microbial community. Inorganic fertilizer addition may dampen the positive effects of organic fertilizer addition on soil total PLFA, fungi and bacteria, so there may be an antagonism effect between organic and inorganic fertilizers on the soil microbial community. There may be interactive effects of N, P and K fertilizers on the soil microbial community. The effect of nitrogen addition on soil microbial community varied with the different forms of nitrogen that were applied. The effect of fertilization on soil microbial community varies among different ecosystems.
[2] BaiZ, ZhangM, YanY et al. Effect of long-term fertilization of nitrogen, phosphorus and organic fertilizer on PLFA in Chinese arable mollisol. Journal of Zhejiang University: Agriculture and Life Science, 34, 73-80(2008).
[7] FuG, Shen ZX. Response of alpine plants to nitrogen addition on the Tibetan Plateau: A meta-analysis. Journal of Plant Growth Regulation, 35, 974-979(2016).
[13] FuG, Shen ZX, Zhang XZ et al. Response of soil microbial biomass to short-term experimental warming in alpine meadow on the Tibetan Plateau. Applied Soil Ecology, 61, 158-160(2012).
[14] FuG, Shen ZX, Zhang XZ et al. Response of microbial biomass to grazing in an alpine meadow along an elevation gradient on the Tibetan Plateau. European Journal of Soil Biology, 52, 27-29(2012).
[15] FuG, SunW, LiS et al. Response of microbial communities in soil to multi-level warming in a highland barley system of the Lhasa River. Journal of Resources and Ecology, 10, 373-378(2019).
[16] FuG, Zhang HR, Li SW et al. A meta-analysis of the effects of warming and elevated CO2 on soil microbes. Journal of Resources and Ecology, 10, 69-76(2019).
[17] FuG, Zhang HR, SunW. Response of plant production to growing/non-growing season asymmetric warming in an alpine meadow of the Northern Tibetan Plateau. Science of the Total Environment, 650, 2666-2673(2019).
[18] Hedges LV, GurevitchJ, Curtis PS. The meta-analysis of response ratios in experimental ecology. Ecology, 80, 1150-1156(1999).
[20] Li YJ, ChenX, Shamsi IH et al. Effects of irrigation patterns and nitrogen fertilization on rice yield and microbial community structure in paddy soil. Pedosphere, 22, 661-672(2012).
[23] Moscatelli MC, LagomarsinoA, MarinariS et al. Soil microbial indices as bioindicators of environmental changes in a poplar plantation. Ecological Indicators, 5, 171-179(2005).
[24] NaoiseN, BrajeshS, EileenR et al. Sheep-urine-induced changes in soil microbial community structure. Fems Microbiology Ecology, 56, 310-320(2006).
[25] Rosenberg MS, Adams DC, GurevitchJ. Meta win: Statistical software for meta-analysis. Version 2. Sinauer Associates, Sunderland, Massachusetts, USA.(2000).
[26] Treseder KK. Nitrogen additions and microbial biomass: A meta- analysis of ecosystem studies. Ecology Letters, 11, 1111-1120(2008).
[28] Wu JS, FuG. Modelling aboveground biomass using MODIS FPAR/LAI data in alpine grasslands of the Northern Tibetan Plateau. Remote Sensing Letters, 9, 150-159(2018).
[29] Yeates GW, Bardgett RD, CookR. Faunal and microbial diversity in three welsh grassland soils under conventional and organic management regimes. Journal of Applied Ecology, 34, 453-470(1997).
[30] Yu CQ, Han FS, FuG. Effects of 7 years experimental warming on soil bacterial and fungal community structure in the Northern Tibet alpine meadow at three elevations. Science of the Total Environment, 655, 814-822(2019).
[31] Zak DR, Pregitzer KS, Burton AJ et al. Microbial responses to a changing environment: Implications for the future functioning of terrestrial ecosystems. Fungal Ecology, 4, 386-395(2011).
[32] Zeng LS, LiaoM, Chen CL et al. Effects of lead contamination on soil enzymatic activities, microbial biomass, and rice physiological indices in soil-lead-rice (Oryza sativa L.) system. Ecotoxicology and Environmental Safety, 67, 67-74(2007).
[33] Zhang XZ, Shen ZX, FuG. A meta-analysis of the effects of experimental warming on soil carbon and nitrogen dynamics on the Tibetan Plateau. Applied Soil Ecology, 87, 32-38(2015).
Jiangwei WANG, Guangyu ZHANG, Chengqun YU. A Meta-analysis of the Effects of Organic and Inorganic Fertilizers on the Soil Microbial Community[J]. Journal of Resources and Ecology, 2020, 11(3): 298