• Spectroscopy and Spectral Analysis
  • Vol. 42, Issue 10, 3243 (2022)
En-jun KUANG1、*, Feng-qin CHI1、1;, Jiu-ming ZHANG1、1;, Ming-gang XU2、2; *;, Colinet Gilles3、3;, Qing-rui SU1、1;, Xiao-yu HAO1、1;, Bao-guo ZHU4、4;, and [in Chinese]3、3;
Author Affiliations
  • 11. Heilongjiang Academy of Black Soil Conservation & Utilization, The Key Laboratory of Soil Environment and Plant Nutrition of Heilongjiang Province, Harbin 150086, China
  • 22. Institute of Agricultural Resources and Regional Planning, Chinese Academy of Agricultural Sciences, Beijing 100081, China
  • 33. Department of Biosystems Engineering (BIOSE), Gembloux Agro-Bio Tech of Université de Liège, Jean Bru, Belgium
  • 44. Jiamusi Branch of Heilongjiang Academy of Agricultural Sciences, Jiamusi 154007, China
  • show less
    DOI: 10.3964/j.issn.1000-0593(2022)10-3243-06 Cite this Article
    En-jun KUANG, Feng-qin CHI, Jiu-ming ZHANG, Ming-gang XU, Colinet Gilles, Qing-rui SU, Xiao-yu HAO, Bao-guo ZHU, [in Chinese]. Analysis of DOC Component Structure of Black Soil Profile With Straw Deeply Bried and Based on Fluorescence Spectrum[J]. Spectroscopy and Spectral Analysis, 2022, 42(10): 3243 Copy Citation Text show less
    The content of DOC and percentage of DOC and SOC in different treatments
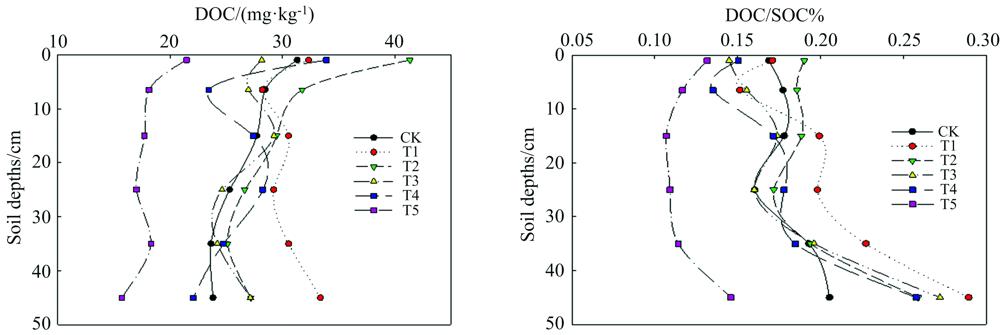
    Fig. 1. The content of DOC and percentage of DOC and SOC in different treatments
    Three dimensional fluorescence components of soil DOC in different treatmentsNote: Peak A: fulvic-acid-like in UV region; Peak T: short wave tryptophan-like (protein-like); Peak B: Tyrosine-like (protein-like)
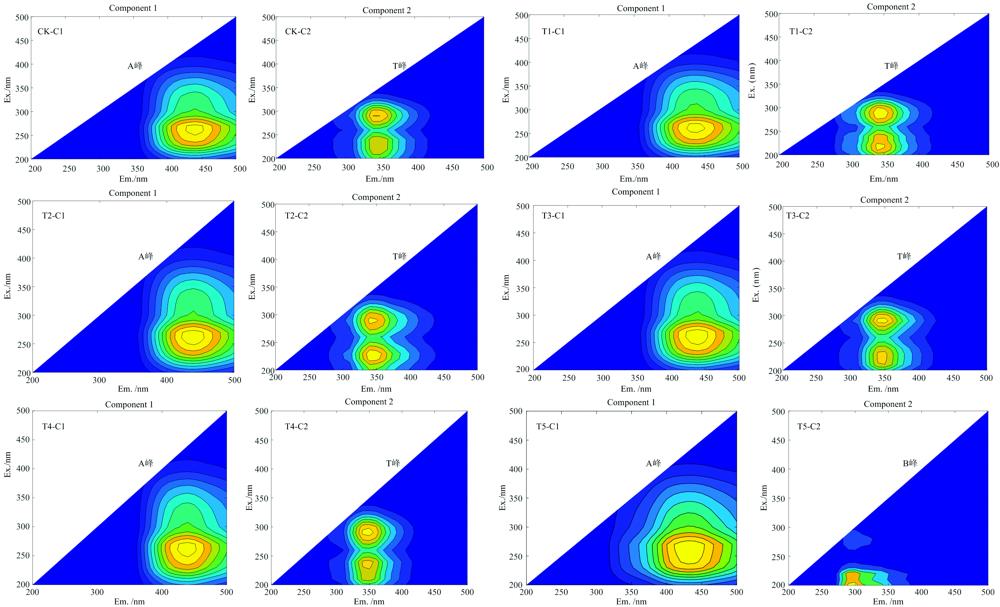
    Fig. 2. Three dimensional fluorescence components of soil DOC in different treatments
    Note: Peak A: fulvic-acid-like in UV region; Peak T: short wave tryptophan-like (protein-like); Peak B: Tyrosine-like (protein-like)
    处理FIBIXHIX
    CK1.49±0.020.89±0.20a0.72±0.16
    T11.49±0.040.97±0.06a0.72±0.04
    T21.50±0.060.83±0.15ab0.76±0.09
    T31.54±0.030.88±0.17a0.76±0.09
    T41.51±0.050.91±0.17a0.75±0.06
    T51.52±0.050.68±0.03b0.83±0.04
    Table 1. Average fluorescence spectral index of soil DOC in different treatments
    处理C1C2C1+C2相对百分比/%
    C1C2
    CK1 191.21±571.61827.41±416.34ab2 018.62±860.5855.7944.21
    T11 129.28±529.871 143.47±176.79a2 272.75±567.5446.8453.16
    T21 253.68±562.98794.99±273.44ab2 048.67±768.8857.7742.23
    T31 269.22±418.39932.04±127.29ab2 201.26±407.5456.2443.76
    T41 396.80±145.951 156.04±418.43a2 552.84±498.0555.8744.13
    T51 404.37±144.76697.19±209.51b2 101.56±276.9567.1932.81
    Table 2. Fluorescence intensity and relative percentage of soil DOC fluorescence components
    DOCDOC/SOC
    /%
    C1
    (类腐殖质)
    C2
    (类蛋白质)
    处理0.0000.0000.0000.000
    土壤深度0.0000.0000.0000.000
    处理×土壤深度0.0000.0000.0000.000
    R-Sq94.08%95.41%99.68%99.05%
    Table 3. Average fluorescence spectral index of soil DOC under different treatment
    En-jun KUANG, Feng-qin CHI, Jiu-ming ZHANG, Ming-gang XU, Colinet Gilles, Qing-rui SU, Xiao-yu HAO, Bao-guo ZHU, [in Chinese]. Analysis of DOC Component Structure of Black Soil Profile With Straw Deeply Bried and Based on Fluorescence Spectrum[J]. Spectroscopy and Spectral Analysis, 2022, 42(10): 3243
    Download Citation