
Rongrong Lu, Haibo Sun, Shuangfei Fu, Feng Zhu, Yingming Hao. Point Cloud Registration Based Satellite Motion Parameter Identification Method[J]. Laser & Optoelectronics Progress, 2019, 56(14): 141503
- Laser & Optoelectronics Progress
- Vol. 56, Issue 14, 141503 (2019)
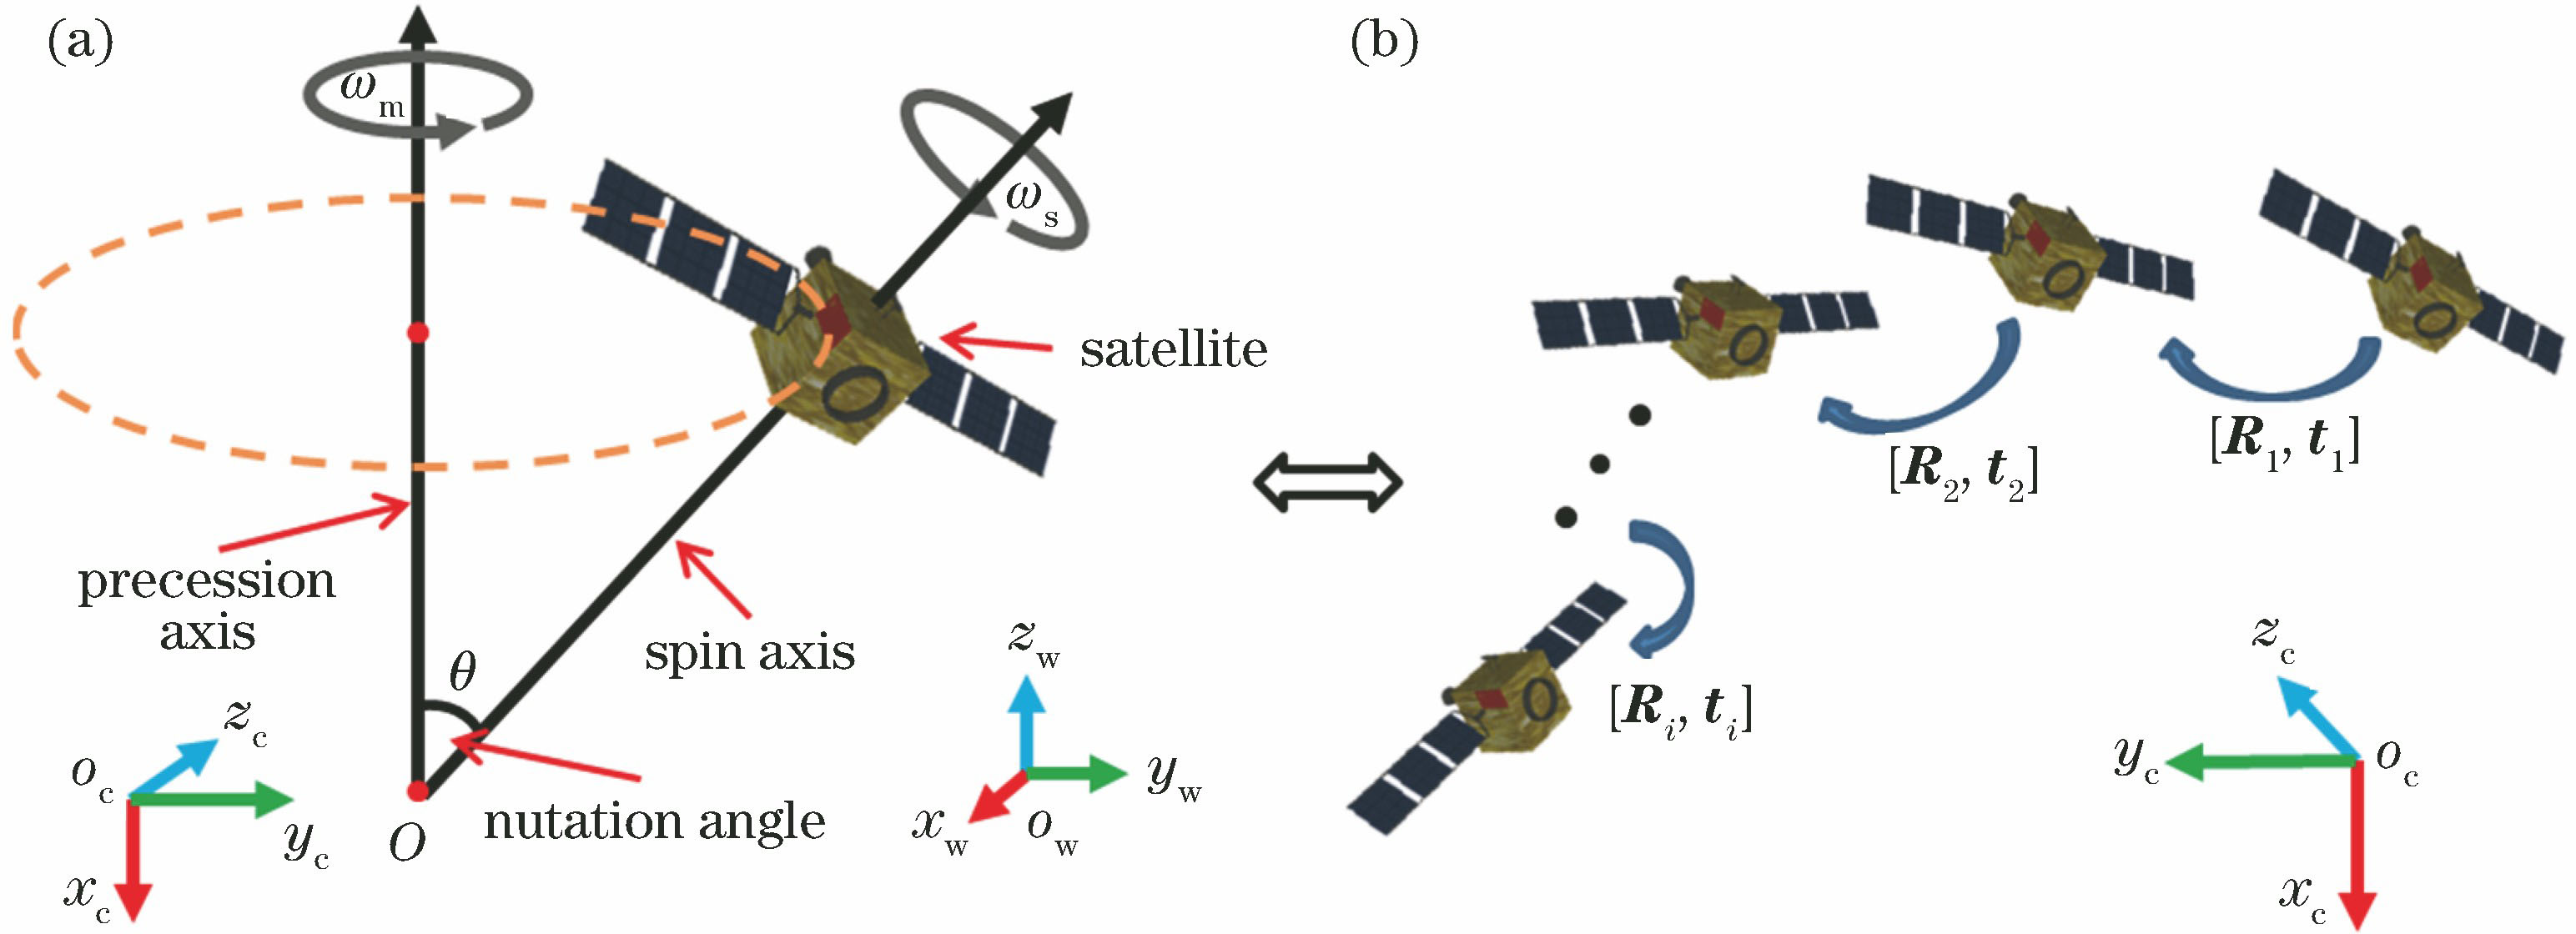
Fig. 1. Illustration of satellite self-rotation and precession
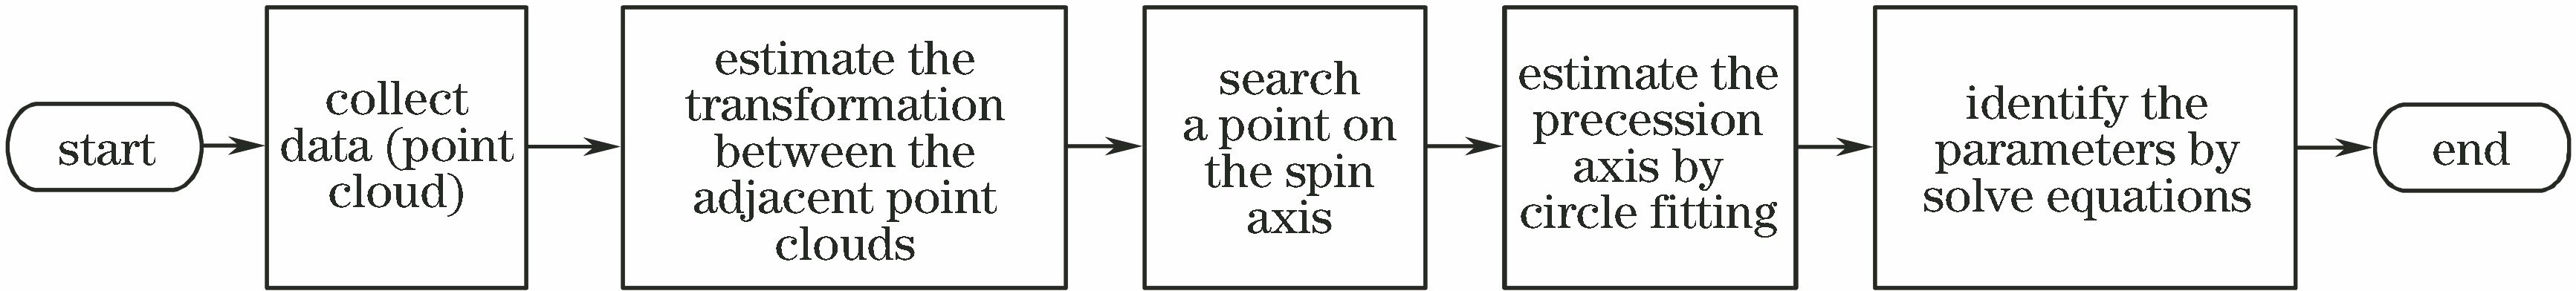
Fig. 2. Flow chart of satellite motion parameter identification algorithm
Fig. 3. Diagram of circle fitting
Fig. 4. Diagram of relationship among motion parameters
Fig. 5. Function introduction of simulation software. (a) Size of satellite model and initial azimuth information of sensor model;(b)-(d) parameters of camera model, setting interface of motion parameters, and data acquisition interface in simulation software
Fig. 6. Illustration of satellite data. (a) Color image; (b) depth image; (c) 3D point cloud
Fig. 7. Registration error between two adjacent point clouds. (a) α; (b) β; (c) γ; (d) tx; (e) ty; (f) tz
Fig. 8. Comparison between two adjacent point clouds before and after registration. (a) Before registration; (b) after registration
Fig. 9. Results of circle fitting under different Gaussian noise. (a) σ=0.01 m; (b) σ=0.02 m; (c) σ=0.03 m; (d) σ=0.04 m; (e) σ=0.05 m; (f) σ=0.06 m; (g) σ=0.07 m; (h) σ=0.08 m; (i) σ=0.09 m
Fig. 10. Errors of center of circle, radius and normal angle of fitting circle under different level of noise.(a) Center of circle; (b) radius; (c) normal vector
Fig. 11. Estimated error of each group of three estimated parameters. (a) Angular velocity of precession; (b) angular velocity of spin; (c) angle of nutation
Fig. 12. Parameter identification error changes with point cloud noise intensity. (a) Angular velocity of precession; (b) angular velocity of spin; (c) angle of nutation
Fig. 13. Illustration of satellite data. (a) Color image; (b) depth image; (c) 3D point cloud
Fig. 14. Intermediate results of parameter identification. (a) Point cloud of satellite; (b) motion track of point on satellite; (c) distribution of estimated speed of self-rotation
| ||||||||||||||||||||||||||||||||||||||||||||||||||||||||||||||||||||||||||||||||||||||||||||||||||||||||||||||||||||||
Table 1. Identification results under 15 different groups of motion parameters by our method

Set citation alerts for the article
Please enter your email address
© Copyright 2018-2021 | Chinese Laser Press. All Rights Reserved 沪ICP备15018463号-20