• Laser & Optoelectronics Progress
  • Vol. 58, Issue 14, 1410006 (2021)
Yuanyuan Chen1, Weilan Wang2、*, Huaming Liu3, Zhengqi Cai1, and Penghai Zhao2
Author Affiliations
  • 1College of Mathematics and Computer Science, Northwest Minzu University, Lanzhou, Gansu 730030, China
  • 2Key Laboratory of China’s Ethnic Languages and Information Technology of Ministry of Education, Northwest Minzu University, Lanzhou, Gansu 730030, China
  • 3College of Computer and Information Engineering, Fuyang Normal University, Fuyang, Anhui 236041, China
  • show less
    DOI: 10.3788/LOP202158.1410006 Cite this Article Set citation alerts
    Yuanyuan Chen, Weilan Wang, Huaming Liu, Zhengqi Cai, Penghai Zhao. Layout Segmentation and Description of Tibetan Document Images Based on Adaptive Run Length Smoothing Algorithm[J]. Laser & Optoelectronics Progress, 2021, 58(14): 1410006 Copy Citation Text show less
    Tibetan document image
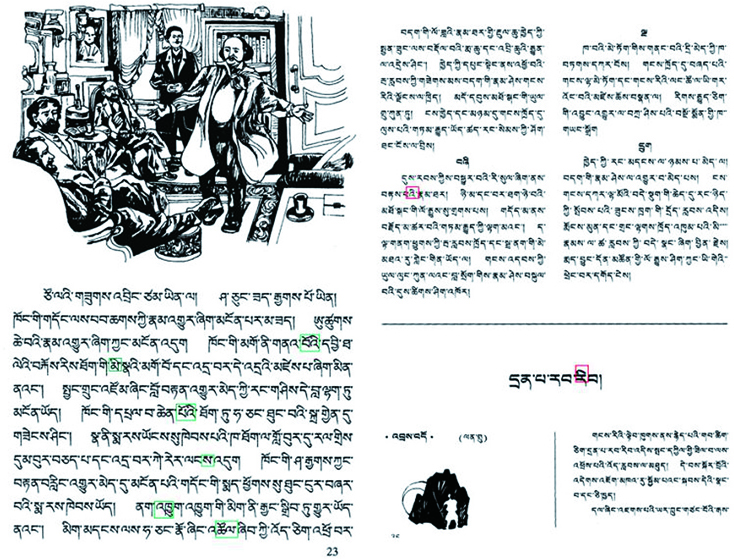
    Fig. 1. Tibetan document image
    Flow chart of layout analysis method
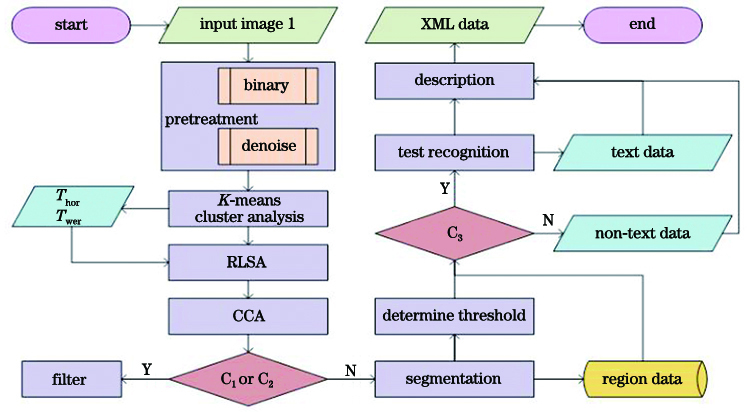
    Fig. 2. Flow chart of layout analysis method
    RLSA samples. (a) Pixels before smoothing; (b) pixels after smoothing
    Fig. 3. RLSA samples. (a) Pixels before smoothing; (b) pixels after smoothing
    ARLSA process of text lines in Tibetan document images. (a) Binary figures; (b) ARLSA processing results
    Fig. 4. ARLSA process of text lines in Tibetan document images. (a) Binary figures; (b) ARLSA processing results
    Filtering results in connected domains. (a) ARLSA processing result; (b) rectangular outer box for connected domains; (c) filtering result
    Fig. 5. Filtering results in connected domains. (a) ARLSA processing result; (b) rectangular outer box for connected domains; (c) filtering result
    Vowel attribution separated from baseline. (a) ARLSA processing result of text line; (b) centroids of connected components; (c) vertical distance between centroids; (d) filtering result
    Fig. 6. Vowel attribution separated from baseline. (a) ARLSA processing result of text line; (b) centroids of connected components; (c) vertical distance between centroids; (d) filtering result
    Cluster analysis graphs of random segmentation block sample data. (a) Random sample data distribution; (b) K=3 cluster
    Fig. 7. Cluster analysis graphs of random segmentation block sample data. (a) Random sample data distribution; (b) K=3 cluster
    Structural diagram of layout data
    Fig. 8. Structural diagram of layout data
    Word segmentation and recognition. (a) Separation of vowels and base words, and word adhesion; (b) segmentation result; (c) recognition result
    Fig. 9. Word segmentation and recognition. (a) Separation of vowels and base words, and word adhesion; (b) segmentation result; (c) recognition result
    Layout analysis results. (a) Original image; (b) target connected region; (c) classification result of layout elements; (d) layout description
    Fig. 10. Layout analysis results. (a) Original image; (b) target connected region; (c) classification result of layout elements; (d) layout description
    Wrong classification images. (a)(c) Original images; (b)(d) wrong classification results
    Fig. 11. Wrong classification images. (a)(c) Original images; (b)(d) wrong classification results
    Cluster centerCenter 1Center 2Center 3Center 4
    Widthw1w2w3w4
    Heighth1h2h3h4
    Table 1. Data representation of cluster centers in connected components
    Yuanyuan Chen, Weilan Wang, Huaming Liu, Zhengqi Cai, Penghai Zhao. Layout Segmentation and Description of Tibetan Document Images Based on Adaptive Run Length Smoothing Algorithm[J]. Laser & Optoelectronics Progress, 2021, 58(14): 1410006
    Download Citation