• Laser & Optoelectronics Progress
  • Vol. 57, Issue 8, 080002 (2020)
Xuejie Ma, Rong Liu, Chenxi Li*, Wenliang Chen, and Kexin Xu
Author Affiliations
  • State Key Laboratory of Precision Measuring Technology and Instruments, School of Precision Instruments & Opto-electronics Engineering, Tianjin University, Tianjin 300072, China
  • show less
    DOI: 10.3788/LOP57.080002 Cite this Article Set citation alerts
    Xuejie Ma, Rong Liu, Chenxi Li, Wenliang Chen, Kexin Xu. Hyperspectral Imaging of in vivo Tissues: A Review[J]. Laser & Optoelectronics Progress, 2020, 57(8): 080002 Copy Citation Text show less
    Absorption spectrum of main ingredients in human tissues[25]
    Fig. 1. Absorption spectrum of main ingredients in human tissues[25]
    Schematic of hyperspectral imaging system
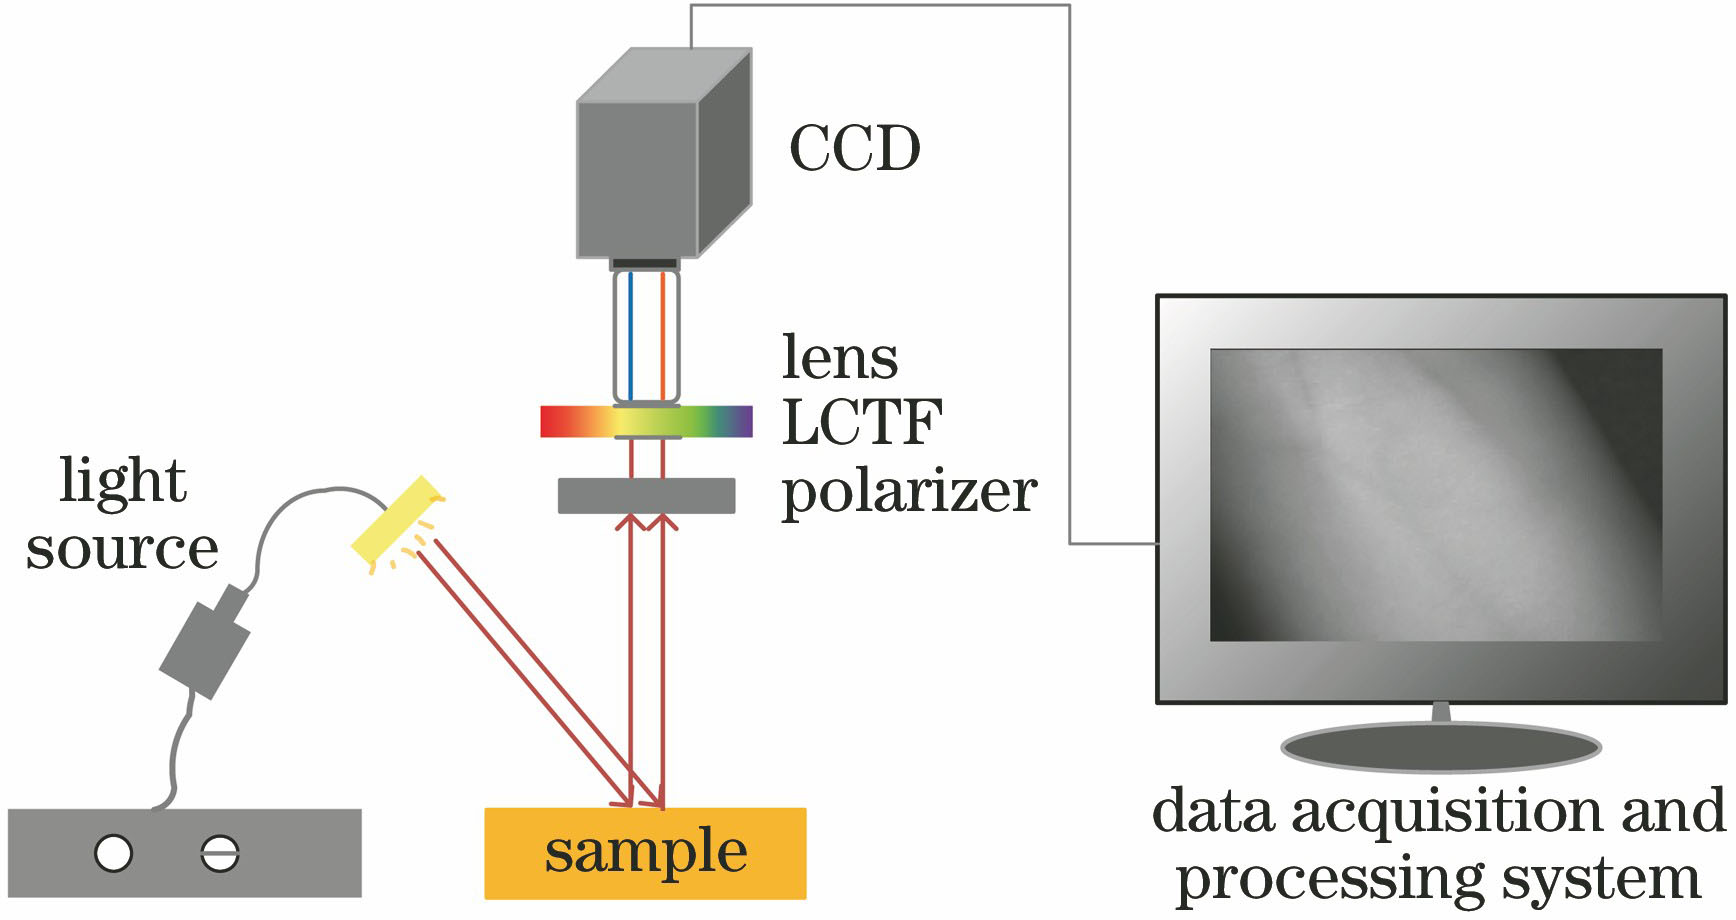
    Fig. 2. Schematic of hyperspectral imaging system
    Reflectance spectra of normal and burned skin tissue[60]
    Fig. 3. Reflectance spectra of normal and burned skin tissue[60]
    Spatial distribution of blood oxygen saturation[64]. (a) Healthy women (29 years old); (b) zero-order color image of (a); (c) healthy male (58 years old); (d) zero-order color image of (c)
    Fig. 4. Spatial distribution of blood oxygen saturation[64]. (a) Healthy women (29 years old); (b) zero-order color image of (a); (c) healthy male (58 years old); (d) zero-order color image of (c)
    Visualization of a tumor with green fluorescence protein (GFP)[70]. (a) Hyperspectral corresponding RGB image; (b) preprocessed spectral images at different wavelengths; (c) spectral curve of cancerous and healthy tissues
    Fig. 5. Visualization of a tumor with green fluorescence protein (GFP)[70]. (a) Hyperspectral corresponding RGB image; (b) preprocessed spectral images at different wavelengths; (c) spectral curve of cancerous and healthy tissues
    ModeWhiskbroomPushbroomStaringSnapshot
    ScanningBoth spatial scansOne of the spatial scansSpectral scanNo scan
    Spectral dispersion elementPrism, gratingPrism, gratingTunable filter or Fabry-Perot interferometerPrism, grating
    Spectral resolution /nm6.00.6-3.03.010.0
    Acquisition time /s90.0240.0-300.08.0-12.00.2
    Table 1. Comparison of spectrometers with different imaging methods
    ImagerLight sourceDispersive deviceWavelengthrange /nmResolution /(pixel×pixel)
    HySpex[34-35]Tungsten halogen lamp160 filters400-10001280×1024
    Multispectral imaging system[36]Halogen lamp23 filters460-8101024×1024
    Monochromatic digitalcamera imaging system[8]Quartz halogen lamp16 narrowband filters480-8864008×2672
    ASCLEPIOS[37]Xenon arc lamp10 medium bandpassinterference filters430-7801312×1082
    xiSpec[32]LED ring lightFabry-Perot filter470-6302048×1088
    Hyperspectral imaging system[38]LED ring lightLCTF500-6201392×1040
    OxyVu[39-40]LED lightLCTF400-7201392×1040
    Nuance 2.4[41]Tungsten incandescent lampLCTF500-7001392×1040
    Multispectral imaging system[42]OSL1 fiber light sourceLCTF400-7202048×2048
    Hyperspectralimaging system[43]Fiber-opticring illuminatorFabry-Perotinterferometer500-9001010×1010
    Portable multispectralimaging system[33]A set of LEDs in thevisible and NIR regionNo400-9482592×1944
    Table 2. Hyperspectral imaging system summary
    Xuejie Ma, Rong Liu, Chenxi Li, Wenliang Chen, Kexin Xu. Hyperspectral Imaging of in vivo Tissues: A Review[J]. Laser & Optoelectronics Progress, 2020, 57(8): 080002
    Download Citation