
Miaomiao Qiu, Xiongli Chai, Feng Shao. Saliency Detection Model for Stereoscopic Panoramic Images[J]. Laser & Optoelectronics Progress, 2021, 58(8): 0810002
- Laser & Optoelectronics Progress
- Vol. 58, Issue 8, 0810002 (2021)
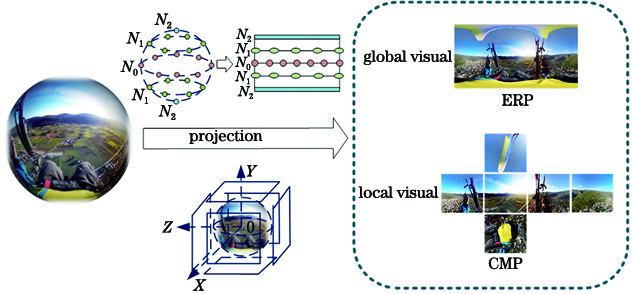
Fig. 1. Illustration of projection format for panoramic image
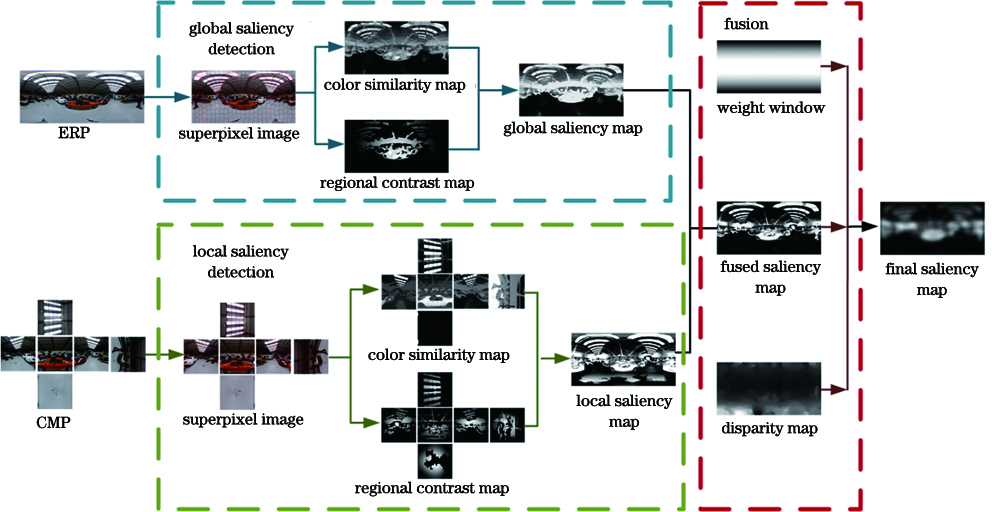
Fig. 2. Overall framework of proposed method
Fig. 3. Results of superpixel segmentation of SLIC for global images. (a) Original images; (b) results of superpixel segmentation for K=1200; (c) results of superpixel segmentation for K=600; (d) results of superpixel segmentation for K=300
Fig. 4. Results of superpixel segmentation of local images. (a) Original images; (b) six projection surfaces of CMP; (c) results of superpixel segmentation for K=600
Fig. 5. Original images and saliency maps achieved based on color similarity. (a) Original images; (b) saliency maps achieved based on color similarity
Fig. 6. Original images and saliency maps achieved based on local contrast. (a) Original images; (b) saliency maps achieved based on local contrast
Fig. 7. Procedure of proposed saliency framework
Fig. 8. Illustration of fused saliency map of ERP and CMP maps
Fig. 9. 3D saliency maps. (a) Original images; (b) disparity maps; (c) stereoscopic saliency maps; (d) final fused saliency maps
Fig. 10. Comparison of performance of different saliency detection models
Fig. 11. Precision-recall curves of different saliency models
Fig. 12. Precision, recall, and F-measure of different saliency models
|
Table 1. Comparison of performance evaluation indexes of different objective evaluation models
|
Table 2. Comparison of evaluation performance of ERP and CMP projection formats

Set citation alerts for the article
Please enter your email address
© Copyright 2018-2021 | Chinese Laser Press. All Rights Reserved 沪ICP备15018463号-20