• Laser & Optoelectronics Progress
  • Vol. 57, Issue 5, 053002 (2020)
Youliang Yang, Lu Wang*, and Cuihong Ma
Author Affiliations
  • College of Electrical Engineering, North China University of Science and Technology, Tangshan, Hebei 063210, China
  • show less
    DOI: 10.3788/LOP57.053002 Cite this Article Set citation alerts
    Youliang Yang, Lu Wang, Cuihong Ma. Quantitative Analysis of Liquid Steel Element in LIBS Using SVR Improved by Particle Swarm Optimization[J]. Laser & Optoelectronics Progress, 2020, 57(5): 053002 Copy Citation Text show less
    LIBS experimental platform
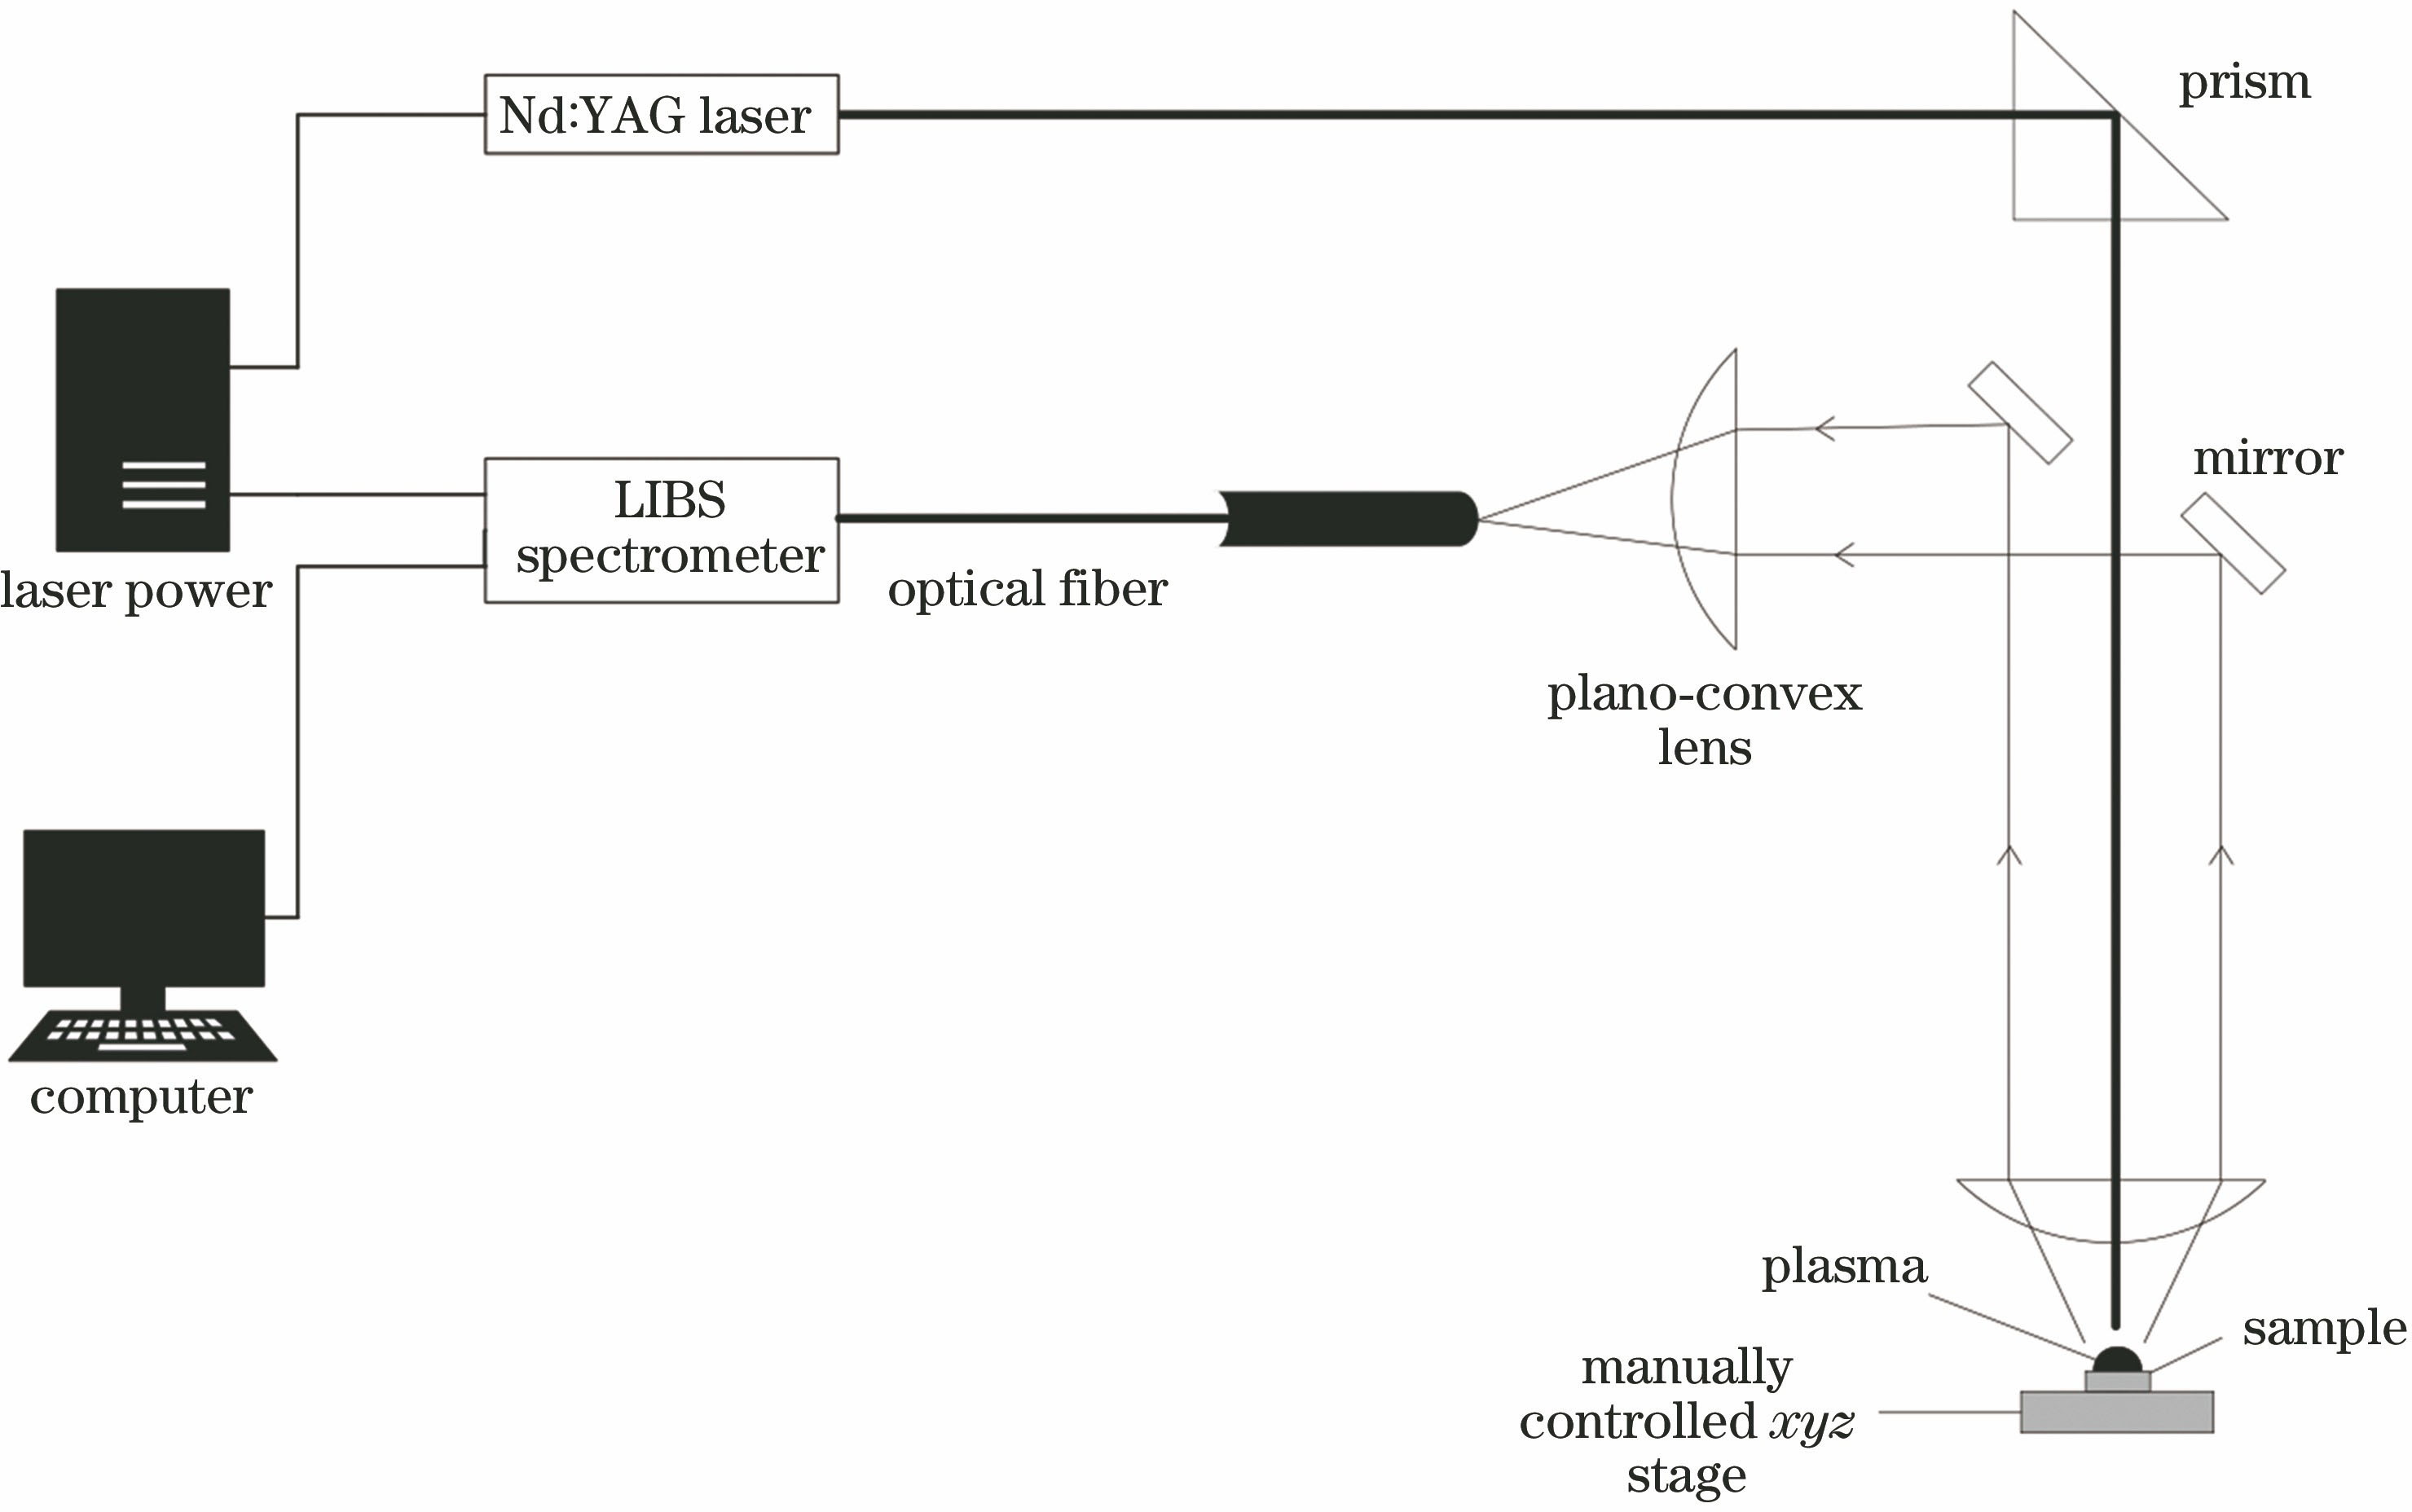
    Fig. 1. LIBS experimental platform
    Liquid steel sample
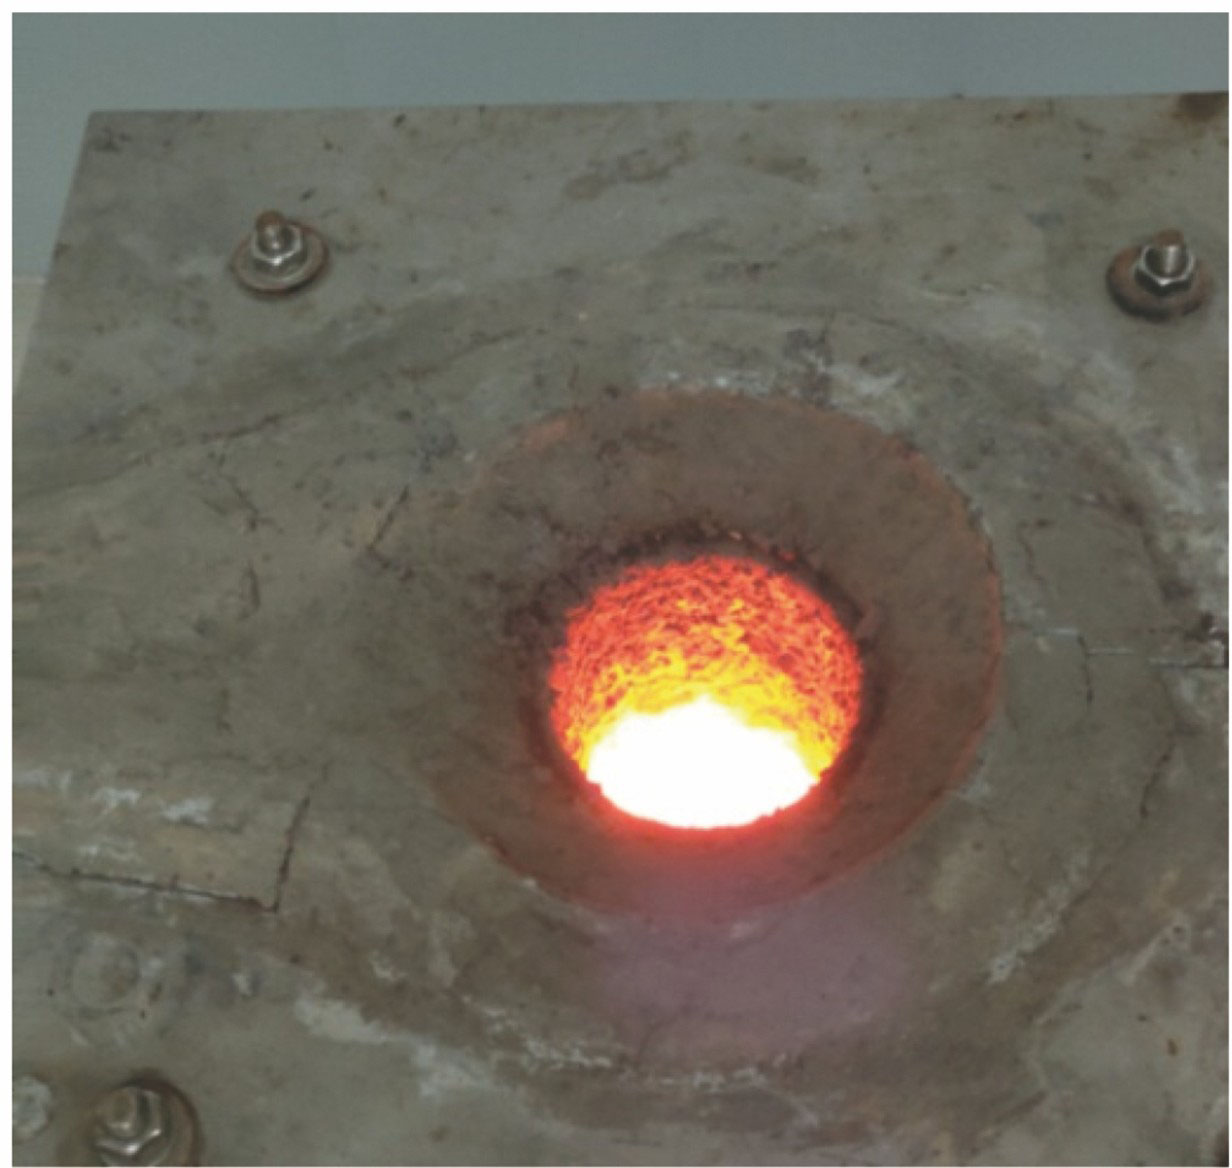
    Fig. 2. Liquid steel sample
    LIBS spectrum of ERM284-2D
    Fig. 3. LIBS spectrum of ERM284-2D
    Flow chart of SVR and Cat-fish PSO-SVR algorithms
    Fig. 4. Flow chart of SVR and Cat-fish PSO-SVR algorithms
    Fitness changing curve of Cat-fish PSO
    Fig. 5. Fitness changing curve of Cat-fish PSO
    Results of elemental prediction analysis in molten steel
    Fig. 6. Results of elemental prediction analysis in molten steel
    SampleFeMnNiCrSiCuCoPS
    ERM281-170.3299.3700.2580.1761.9290.0480.0230.0120.016
    ERM282-167.15010.8600.4751.1090.7340.08600.0190.004
    ERM279-275.78610.6030.7862.1071.5160.088000
    ERM284-2D67.49610.7201.7440.1832.5370.0200.0530.0260.024
    ERM287-1D67.43910.3501.4803.2031.5690.0160.1480.0270.001
    ERM289-1D55.23824.6801.1060.0004.5310.0490.0650.0120.003
    ERM292-1D68.92710.0900.9762.1392.4020.0370.0260.0180.006
    ERM295-1D48.36024.4000.3971.4814.4180.0170.0450.0170.001
    ERM296-1D82.0205.7900.5450.1491.2420.1170.0210.0180.003
    ERM298-1D63.3807.0560.3163.2014.2620.0160.0550.0200.001
    Table 1. Element composition of steel samples%
    Component number123456789
    Eigen value9.6747.8615.3493.2450.9340.7610.6700.5110.239
    Cumulative variance contribution /%33.0826.8818.2911.103.192.602.301.750.82
    Table 2. Cumulative variance contribution of each influencing factor
    Corrosion factorPC 1PC 2PC 3PC 4
    Peak intensity0.9670.3770.6540.385
    Integrated intensity0.0190.392-0.1590.959
    Signal-to-back ratio0.0690.8180.041-0.172
    Internal standard corrected element concentration0.5070.0680.882-0.567
    Pulse trigger delay /μs0.2970.0140.1480.069
    Distance /mm0.5030.5520.3470.462
    Spectral peak value-0.4350.4620.2970.293
    Spectral efficiency /%0.514-0.408-0.5020.377
    Intensity of temperature thermal radiation /(J·cm-2·min-1)0.205-0.5380.527-0.151
    Table 3. Eigen vectors of principal components
    ElementSVR modelCat-fish PSO-SVR model
    R2RSD /%RMSE /%R2RSD /%RMSE /%
    Mn0.91026.103.340.95112.461.07
    Ni0. 91776.833.180.96273.170.97
    Cr0. 91749.524.070.98453.991.26
    Si0.90998.273.020.95224.501.43
    Table 4. Regression prediction results for test set
    Youliang Yang, Lu Wang, Cuihong Ma. Quantitative Analysis of Liquid Steel Element in LIBS Using SVR Improved by Particle Swarm Optimization[J]. Laser & Optoelectronics Progress, 2020, 57(5): 053002
    Download Citation