
Wei ZHANG, Fa-qin DONG, Xiao-chun HE, Huai-qing SONG, Yi-lin QIN, Xin XIONG, Zi-han TANG. Release of Phosphorus to Promote Biomineralization of Uranium by Saccharomyces Cerevisiae Based on Spectroscopy Analysis[J]. Spectroscopy and Spectral Analysis, 2021, 41(1): 25
- Spectroscopy and Spectral Analysis
- Vol. 41, Issue 1, 25 (2021)
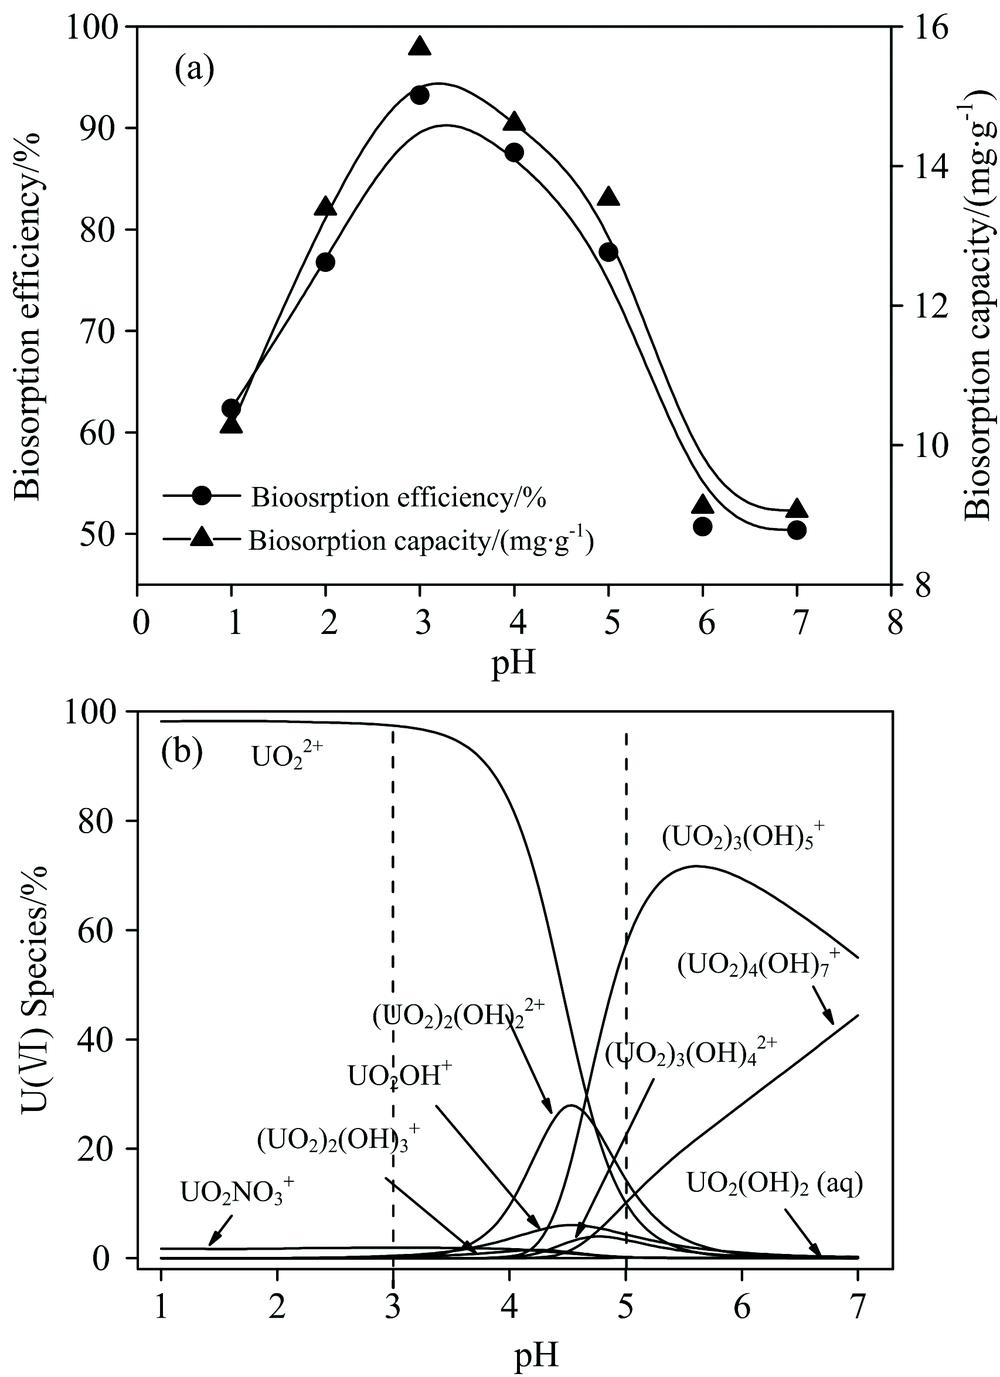
Fig. 1. (a) Effect of initial pH on biosorption of uranium by S. cerevisiae , (b) The relative species distribution of 100 mg·L-1 U(Ⅵ) at different pH calculated by Visual MINTEQ 3.1 (c 0=100 mg·L-1, T =25 ℃, M =5 g·L-1, t =60 min)
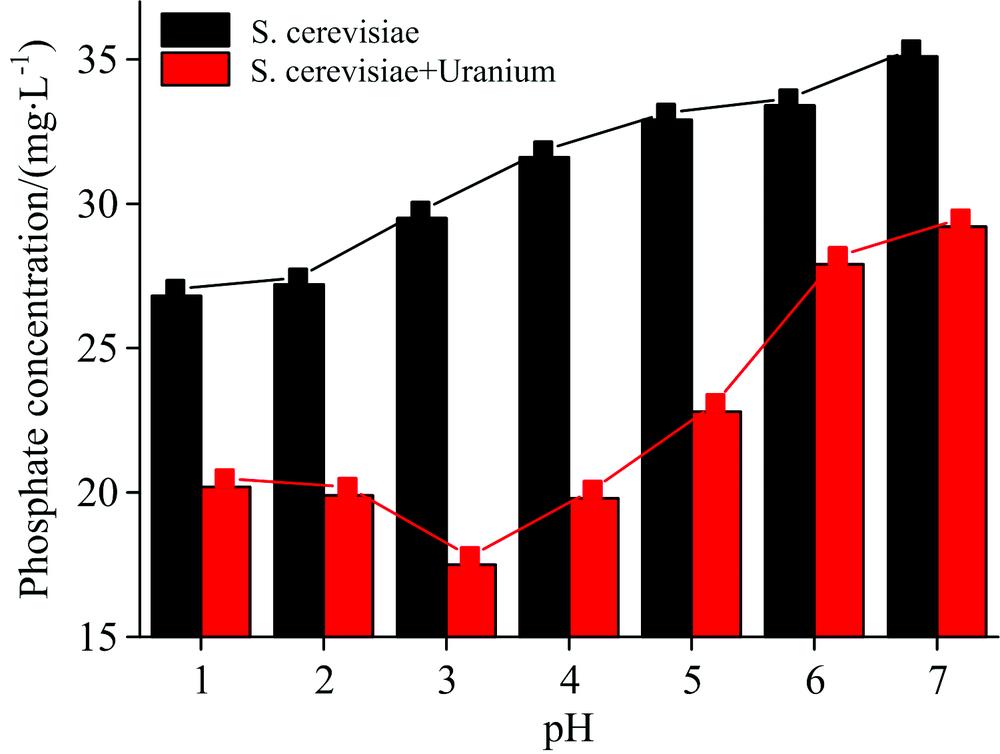
Fig. 2. The changes of phosphorus content after biosorption under different pH
Fig. 3. (a) Effect of reaction time on biosorption of uranium by S. cerevisiae and the pseudo-second-order kinetic model, (b) Webber intraparticle diffusion model (c 0=100 mg·L-1, pH=3.0, T =25 ℃, M =5 g·L-1)
Fig. 4. Effect of temperature on the biosorption of U(Ⅵ) by S. cerevisiae
Fig. 5. (a) FTIR of S. cerevisiae before and after reaction with uranium, (b) FTIR-peak-differentiating analysis in 900~1 800 cm-1 range
Fig. 6. SEM-EDS of S. cerevisiae before and after reaction with uranium
(a): Control; (b): After reaction
(a): Control; (b): After reaction
Fig. 7. X-ray photoelectron binding energy curves of S. cerevisiae before and after biosorption
(a): Full spectrum; (b): U(4f ) spectra; (c): P(2p ) spectra; (d): The ratio of Sp/Sc under different uranium adsorption capacity
(a): Full spectrum; (b): U(4
Fig. 8. XRD patterns of S. cerevisiae before and after biosorption of uranium
|
Table 1. Changes of pH value in the solution before and after biosorption of uranium on S. cerevisiae
|
Table 2. Thermodynamic parameters for the biosorption of uranium by S. cerevisiae

Set citation alerts for the article
Please enter your email address
© Copyright 2018-2021 | Chinese Laser Press. All Rights Reserved 沪ICP备15018463号-20