• Chinese Optics Letters
  • Vol. 19, Issue 12, 121701 (2021)
Cheng Jin1, Ruheng Shi1, Chi Liu1, and Lingjie Kong1、2、*
Author Affiliations
  • 1State Key Laboratory of Precision Measurement Technology and Instruments, Department of Precision Instrument, Tsinghua University, Beijing 100084, China
  • 2IDG/McGovern Institute for Brain Research, Tsinghua University, Beijing 100084, China
  • show less
    DOI: 10.3788/COL202119.121701 Cite this Article Set citation alerts
    Cheng Jin, Ruheng Shi, Chi Liu, Lingjie Kong. Recognizing local artifacts in two-photon imaging of dendrites beneath blood vessels in vivo[J]. Chinese Optics Letters, 2021, 19(12): 121701 Copy Citation Text show less
    Dendrite 3D simulation model. (a) Central axis of dendrites. The coordinate (xs, ys) of a feature point is shown. (b) Modification of dendritic radius. Here, θ is the incline angle between the orthogonal direction of the dendrites (i.e., the direction of the dendritic radius) and the y axis. (c) Typical YZ cross sections at different xs. (d) Generated 3D dendrite model where zf = 0.
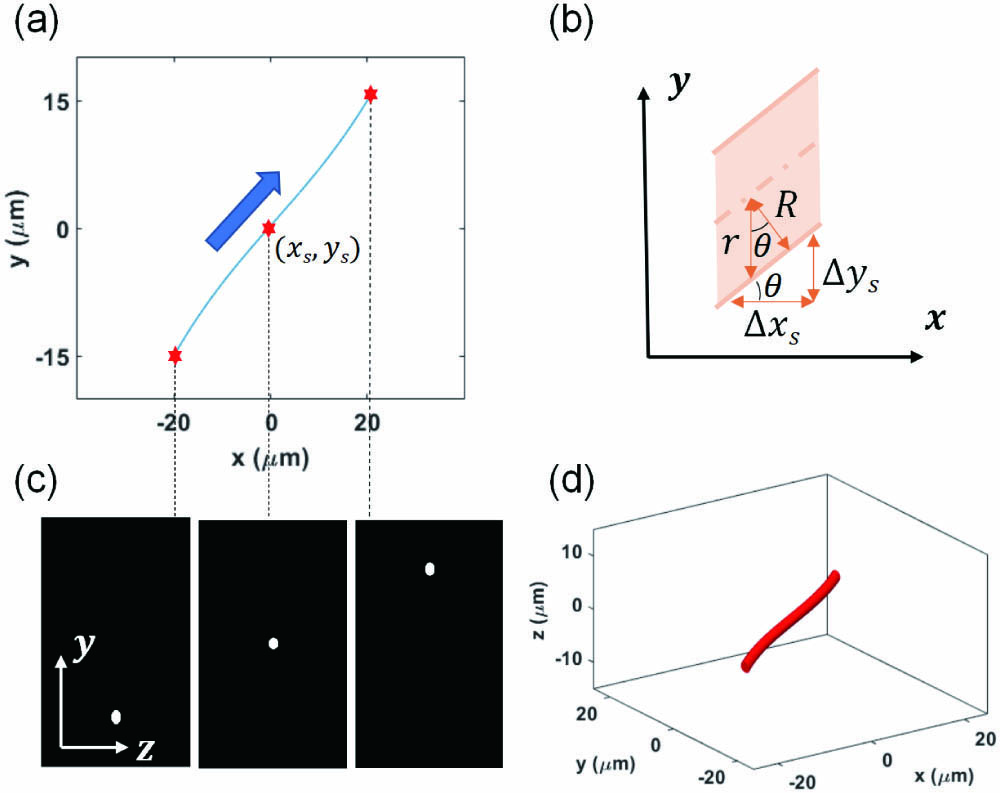
    Fig. 1. Dendrite 3D simulation model. (a) Central axis of dendrites. The coordinate (xs, ys) of a feature point is shown. (b) Modification of dendritic radius. Here, θ is the incline angle between the orthogonal direction of the dendrites (i.e., the direction of the dendritic radius) and the y axis. (c) Typical YZ cross sections at different xs. (d) Generated 3D dendrite model where zf = 0.
    Experimental results of two-photon imaging in the Thy1-YFP mouse cortex in vivo. (a) Imaging stack of the Thy1-YFP mouse cortex. Volume size: 520 µm × 520 µm × 420 µm. (b) Upper: the maximum intensity projection in the XY plane. The white dotted curve shows the boundary of the large blood vessel. Lower: the maximum intensity projection in the YZ plane. The auxiliary line shows the angle between the sample surface and the imaging surface. Scale bar: 100 µm. (c) A superficial plane in the imaging stack. The white dotted curve shows the boundary of the large blood vessel. Scale bar: 100 µm. (d)–(f) Typical cross sections beneath the large blood vessel of the imaging stack at different depths. Here, the z0 plane is defined at a depth in the stack where the close double dendrites appear the most obviously. (d)–(f) show the same area in the box in (c). Scale bar: 20 µm. (g) Intensities along solid lines in (d)–(f). (h) Intensities along dotted lines in (d)–(f).
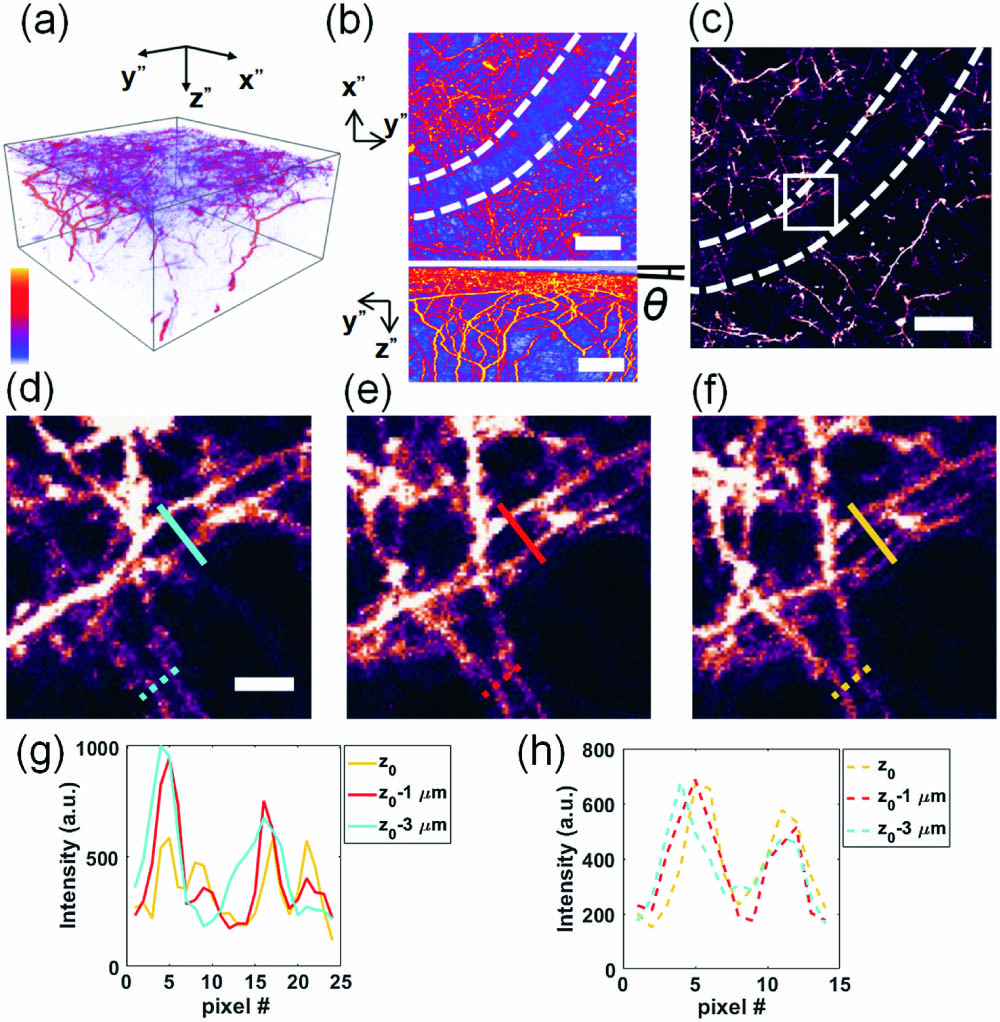
    Fig. 2. Experimental results of two-photon imaging in the Thy1-YFP mouse cortex in vivo. (a) Imaging stack of the Thy1-YFP mouse cortex. Volume size: 520 µm × 520 µm × 420 µm. (b) Upper: the maximum intensity projection in the XY plane. The white dotted curve shows the boundary of the large blood vessel. Lower: the maximum intensity projection in the YZ plane. The auxiliary line shows the angle between the sample surface and the imaging surface. Scale bar: 100 µm. (c) A superficial plane in the imaging stack. The white dotted curve shows the boundary of the large blood vessel. Scale bar: 100 µm. (d)–(f) Typical cross sections beneath the large blood vessel of the imaging stack at different depths. Here, the z0 plane is defined at a depth in the stack where the close double dendrites appear the most obviously. (d)–(f) show the same area in the box in (c). Scale bar: 20 µm. (g) Intensities along solid lines in (d)–(f). (h) Intensities along dotted lines in (d)–(f).
    Numerical simulation of distorted 3D PSFs and the TPM images of the dendrite model under the astigmatism and coma, separately. (a) 3D distribution of the dendrite model with a diameter of 0.2 µm. Inset: the maximum intensity projections in the XY plane. Volume size: 50 µm × 50 µm × 20 µm. (b) Distorted 3D PSF under the effect of the fundamental-order astigmatism Z22, with Zernike coefficient W22 = 0.3 µm. (c) Distorted 3D PSF under the effect of the fundamental-order coma Z31, with Zernike coefficient W31 = 0.1 µm. In (b) and (c), both the 3D normalized intensity distribution (red–white) and the maximum intensity projection on each dimension (gray–white) are shown. Volume size: 10 µm × 10 µm × 20 µm. The wavefront aberration is shown at the upper right. (d), (e) TPM imaging stacks of the dendrite model with distorted 3D PSF in (b) and (c), separately. Volume size: 50 µm × 50 µm × 20 µm. (f)–(h) Typical cross sections in (d). The z0 plane is defined at the depth where the close double dendrites appear the most obviously. Scale bar: 10 µm. (i)–(k) Typical cross sections in (e). The z0 plane is defined at the depth where the dendrites at zf = 0 have the maximum intensity in the imaging stack. (l) The normalized intensities along solid lines in (f)–(h). (m) The normalized intensities along solid lines in (i)–(k). In (l) and (m), intensity normalization is performed with a reference of the maximum value of the three lines. (g), (h) and (i)–(k) have the same color bar, respectively.
    Fig. 3. Numerical simulation of distorted 3D PSFs and the TPM images of the dendrite model under the astigmatism and coma, separately. (a) 3D distribution of the dendrite model with a diameter of 0.2 µm. Inset: the maximum intensity projections in the XY plane. Volume size: 50 µm × 50 µm × 20 µm. (b) Distorted 3D PSF under the effect of the fundamental-order astigmatism Z22, with Zernike coefficient W22 = 0.3 µm. (c) Distorted 3D PSF under the effect of the fundamental-order coma Z31, with Zernike coefficient W31 = 0.1 µm. In (b) and (c), both the 3D normalized intensity distribution (red–white) and the maximum intensity projection on each dimension (gray–white) are shown. Volume size: 10 µm × 10 µm × 20 µm. The wavefront aberration is shown at the upper right. (d), (e) TPM imaging stacks of the dendrite model with distorted 3D PSF in (b) and (c), separately. Volume size: 50 µm × 50 µm × 20 µm. (f)–(h) Typical cross sections in (d). The z0 plane is defined at the depth where the close double dendrites appear the most obviously. Scale bar: 10 µm. (i)–(k) Typical cross sections in (e). The z0 plane is defined at the depth where the dendrites at zf = 0 have the maximum intensity in the imaging stack. (l) The normalized intensities along solid lines in (f)–(h). (m) The normalized intensities along solid lines in (i)–(k). In (l) and (m), intensity normalization is performed with a reference of the maximum value of the three lines. (g), (h) and (i)–(k) have the same color bar, respectively.
    Numerical simulation of distorted 3D PSF and the images of the dendrite models under the mixed wavefront aberrations in TPM and WFM. (a) Distorted 3D excitation PSF in TPM, with Zernike coefficients W22 = 0.3 µm and W31 = 0.1 µm. Both the 3D normalized intensity distribution (red–white) and the maximum intensity projection on each dimension (gray–white) are shown. Volume size: 10 µm × 10 µm × 20 µm. The mixed wavefront aberration is shown at the upper right. (b)–(d) Cross sections of the TPM imaging simulation of the dendrite model. The z0 plane is defined at a depth in the stack where the close double dendrites appear the most obviously. Scale bar: 10 µm. (e) Distorted 3D emission PSF in WFM, with the same wavefront aberrations as that in TPM. (f)–(h) Cross sections of the WFM imaging simulation of the dendrite model. The z0 plane is defined at a depth that has the best imaging contrast of the long dendrite. Scale bar: 10 µm. (i) The normalized intensities along solid lines in (b)–(d). (j) The normalized intensities along dotted lines in (b)–(d). (k) The normalized intensities along solid lines in (f)–(h). (l) The normalized intensities along dotted lines in (f)–(h). In (i)–(l), intensity normalization is performed with a reference of the maximum value of the three lines. (b)–(d) and (f)–(h) have the same color bar, respectively.
    Fig. 4. Numerical simulation of distorted 3D PSF and the images of the dendrite models under the mixed wavefront aberrations in TPM and WFM. (a) Distorted 3D excitation PSF in TPM, with Zernike coefficients W22 = 0.3 µm and W31 = 0.1 µm. Both the 3D normalized intensity distribution (red–white) and the maximum intensity projection on each dimension (gray–white) are shown. Volume size: 10 µm × 10 µm × 20 µm. The mixed wavefront aberration is shown at the upper right. (b)–(d) Cross sections of the TPM imaging simulation of the dendrite model. The z0 plane is defined at a depth in the stack where the close double dendrites appear the most obviously. Scale bar: 10 µm. (e) Distorted 3D emission PSF in WFM, with the same wavefront aberrations as that in TPM. (f)–(h) Cross sections of the WFM imaging simulation of the dendrite model. The z0 plane is defined at a depth that has the best imaging contrast of the long dendrite. Scale bar: 10 µm. (i) The normalized intensities along solid lines in (b)–(d). (j) The normalized intensities along dotted lines in (b)–(d). (k) The normalized intensities along solid lines in (f)–(h). (l) The normalized intensities along dotted lines in (f)–(h). In (i)–(l), intensity normalization is performed with a reference of the maximum value of the three lines. (b)–(d) and (f)–(h) have the same color bar, respectively.
    Cheng Jin, Ruheng Shi, Chi Liu, Lingjie Kong. Recognizing local artifacts in two-photon imaging of dendrites beneath blood vessels in vivo[J]. Chinese Optics Letters, 2021, 19(12): 121701
    Download Citation