
Cheng Jin, Ruheng Shi, Chi Liu, Lingjie Kong, "Recognizing local artifacts in two-photon imaging of dendrites beneath blood vessels in vivo," Chin. Opt. Lett. 19, 121701 (2021)
- Chinese Optics Letters
- Vol. 19, Issue 12, 121701 (2021)
Abstract
Keywords
1. Introduction
Benefiting from minimal invasion, high resolution, high sensitivity, etc., optical imaging of biodynamics provides a large number of physiological and pathological information[
In general, a wavefront aberration is classified as system aberration and sample aberration[
For the conventional wide-field fluorescence microscopy (WFM) based on single-photon excitation, a wavefront aberration suffered by the emission fluorescence is the main concern, which would deteriorate the optical resolution and introduce cross talk[
Sign up for Chinese Optics Letters TOC. Get the latest issue of Chinese Optics Letters delivered right to you!Sign up now
To compensate wavefront aberrations, several wavefront engineering techniques[
Here, we demonstrate an observation of local artifacts in two-photon imaging of dendrites beneath blood vessels in a mouse brain in vivo, which are shown as divided parallel structures at certain imaging depths. To interpret the experimental results, we perform 3D numerical simulations of TPM and find that the local artifacts are induced by the hybrid effect of coma and astigmatism. We also compare the effect of these wavefront aberrations in conventional WFM and TPM and show that the artifacts in nonlinear microscopy are unique.
2. Materials and Methods
The experimental setup is similar to conventional TPMs[
In numerical simulations, we adopt the vector diffraction theory to calculate the PSF[
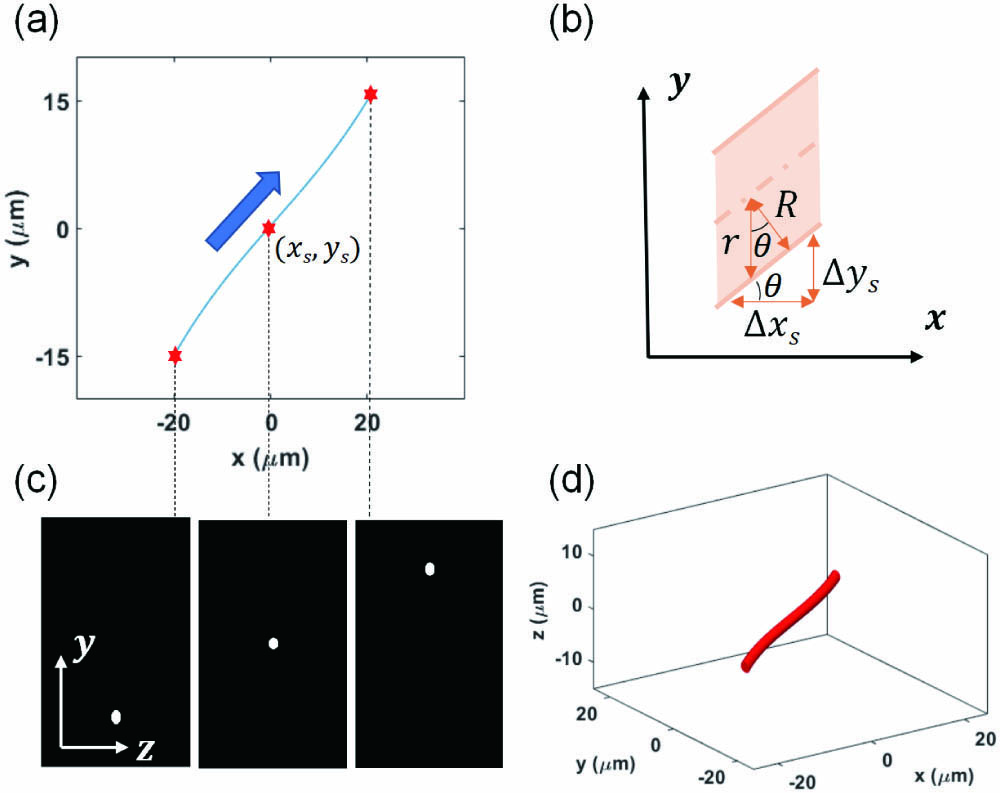
To verify the influence of wavefront aberration on imaging quality, we generate a 3D dendrite model. First, we define the central axial depth
![]()
Figure 1.Dendrite 3D simulation model. (a) Central axis of dendrites. The coordinate (xs, ys) of a feature point is shown. (b) Modification of dendritic radius. Here, θ is the incline angle between the orthogonal direction of the dendrites (i.e., the direction of the dendritic radius) and the y axis. (c) Typical YZ cross sections at different xs. (d) Generated 3D dendrite model where zf = 0.
The modified radius
We traverse the entire dendrite by changing
3. Results
3.1. Experimental observation of local artifacts in two-photon imaging of mouse cortex in vivo
In practical imaging, wavefront aberrations caused by both optical systems and biological samples would deteriorate the image quality or, even worse, induce artifacts. We show a two-photon imaging stack of YFP labeled neurons recorded in the mouse cortex in vivo [Fig. 2(a)]. It can be seen that there is a large blood vessel at the superficial cortex in the FoV, which can be inferred from the dark region of the maximum intensity projection in the
![]()
Figure 2.Experimental results of two-photon imaging in the Thy1-YFP mouse cortex in vivo. (a) Imaging stack of the Thy1-YFP mouse cortex. Volume size: 520 µm × 520 µm × 420 µm. (b) Upper: the maximum intensity projection in the XY plane. The white dotted curve shows the boundary of the large blood vessel. Lower: the maximum intensity projection in the YZ plane. The auxiliary line shows the angle between the sample surface and the imaging surface. Scale bar: 100 µm. (c) A superficial plane in the imaging stack. The white dotted curve shows the boundary of the large blood vessel. Scale bar: 100 µm. (d)–(f) Typical cross sections beneath the large blood vessel of the imaging stack at different depths. Here, the z0 plane is defined at a depth in the stack where the close double dendrites appear the most obviously. (d)–(f) show the same area in the box in (c). Scale bar: 20 µm. (g) Intensities along solid lines in (d)–(f). (h) Intensities along dotted lines in (d)–(f).
Moreover, we check the sample alignment for potential factors of the artifacts and find that the surface of the mouse cortex is tilted relative to the focal plane, with a tilt angle of
3.2. Numerical simulations to interpret the experimental artifacts
To explain the phenomena observed above, we perform numerical simulations of two-photon imaging with wavefront aberrations. As shown above, the cylindrical shape of the blood vasculature and sample tilting are two possible sources of wavefront aberration, with the former one inducing astigmatism[
In Fig. 3, we simulate the effect of these two aberrations on 3D PSF and two-photon images of the dendrite model, separately. In the dendrite model, there are three dendrites, in which two are at
![]()
Figure 3.Numerical simulation of distorted 3D PSFs and the TPM images of the dendrite model under the astigmatism and coma, separately. (a) 3D distribution of the dendrite model with a diameter of 0.2 µm. Inset: the maximum intensity projections in the XY plane. Volume size: 50 µm × 50 µm × 20 µm. (b) Distorted 3D PSF under the effect of the fundamental-order astigmatism Z22, with Zernike coefficient W22 = 0.3 µm. (c) Distorted 3D PSF under the effect of the fundamental-order coma Z31, with Zernike coefficient W31 = 0.1 µm. In (b) and (c), both the 3D normalized intensity distribution (red–white) and the maximum intensity projection on each dimension (gray–white) are shown. Volume size: 10 µm × 10 µm × 20 µm. The wavefront aberration is shown at the upper right. (d), (e) TPM imaging stacks of the dendrite model with distorted 3D PSF in (b) and (c), separately. Volume size: 50 µm × 50 µm × 20 µm. (f)–(h) Typical cross sections in (d). The z0 plane is defined at the depth where the close double dendrites appear the most obviously. Scale bar: 10 µm. (i)–(k) Typical cross sections in (e). The z0 plane is defined at the depth where the dendrites at zf = 0 have the maximum intensity in the imaging stack. (l) The normalized intensities along solid lines in (f)–(h). (m) The normalized intensities along solid lines in (i)–(k). In (l) and (m), intensity normalization is performed with a reference of the maximum value of the three lines. (g), (h) and (i)–(k) have the same color bar, respectively.
We show the 3D PSF under the effect of the fundamental-order astigmatism, which has two foci that are symmetric about the
We further simulate the 3D PSF and two-photon images of the dendrite model under the hybrid wavefront aberrations of astigmatism and coma, as shown in Fig. 4. We show the 3D PSF with the combination of these two Zernike modes, in which the distorted PSF contains two main lobes at different axial positions [Fig. 4(a)]. The same dendrite model is used as above. Three typical cross sections are shown in Figs. 4(b)–4(d). It can be seen that, with the distorted 3D PSF of two main lobes, the experimental phenomena can be reproduced well. The images at different depths vary as the axial distribution of 3D PSF is asymmetric. The artifact at the
![]()
Figure 4.Numerical simulation of distorted 3D PSF and the images of the dendrite models under the mixed wavefront aberrations in TPM and WFM. (a) Distorted 3D excitation PSF in TPM, with Zernike coefficients W22 = 0.3 µm and W31 = 0.1 µm. Both the 3D normalized intensity distribution (red–white) and the maximum intensity projection on each dimension (gray–white) are shown. Volume size: 10 µm × 10 µm × 20 µm. The mixed wavefront aberration is shown at the upper right. (b)–(d) Cross sections of the TPM imaging simulation of the dendrite model. The z0 plane is defined at a depth in the stack where the close double dendrites appear the most obviously. Scale bar: 10 µm. (e) Distorted 3D emission PSF in WFM, with the same wavefront aberrations as that in TPM. (f)–(h) Cross sections of the WFM imaging simulation of the dendrite model. The z0 plane is defined at a depth that has the best imaging contrast of the long dendrite. Scale bar: 10 µm. (i) The normalized intensities along solid lines in (b)–(d). (j) The normalized intensities along dotted lines in (b)–(d). (k) The normalized intensities along solid lines in (f)–(h). (l) The normalized intensities along dotted lines in (f)–(h). In (i)–(l), intensity normalization is performed with a reference of the maximum value of the three lines. (b)–(d) and (f)–(h) have the same color bar, respectively.
Besides, we notice that such phenomena have rarely been reported in WFM. To show the difference of image artifacts induced by wavefront aberrations in TPM and conventional WFM, we simulate the PSF and dendrite images under the same aberration conditions as above. We set the emission wavelength of WFM at 520 nm and show the distorted emission PSF [Fig. 4(e)]. We also show three images at different cross sections [Figs. 4(f)–4(h)]. Due to the lack of optical sectioning capability in WFM, the fluorescence signals at other depths near the imaging plane will cause background signals to the imaging plane. Therefore, different from that in TPM, the image of a dendrite at
4. Discussion
In this paper, we report the local artifacts of divided parallel structures at certain depths in two-photon imaging of dendrites beneath blood vessels. Through numerical simulations, we find that the artifacts are mainly induced by astigmatism and coma, resulting from the cylindrical shape of the blood vasculature and sample tilting, respectively. Besides, we numerically verify that the artifacts in TPM and WFM are different.
It should also be noted that the artifacts reported here are so localized that the adoption of adaptive optics becomes less valuable. This is because the compensation wavefront is only constructive in a limited area, but destructive elsewhere. However, such artifacts should be recognized in properly interpreting the imaging results.
References
[1] D. Wang, J. Xia. Optics based biomedical imaging: principles and applications. J. Appl. Phys., 125, 191101(2019).
[2] K. Akassoglou, M. Merlini, V. A. Rafalski, R. Real, L. Liang, Y. Jin, S. E. Dougherty, V. D. Paola, D. J. Linden, T. Misgeld, B. Zheng. In vivo imaging of CNS injury and disease. J. Neurosci., 37, 10808(2017).
[3] Y. Ozeki. Molecular vibrational imaging by stimulated Raman scattering microscopy: principles and applications. Chin. Opt. Lett., 18, 121702(2020).
[4] L. Zhu, Y. Wang, Y. Yuan, H. Zhou, Y. Zhao, Z. Ma. Spectral domain optical coherence tomography with sub-micrometer sensitivity for measurement of central corneal thickness. Chin. Opt. Lett., 17, 041701(2019).
[5] G. Sancataldo, L. Silvestri, A. L. A. Mascaro, L. Sacconi, F. S. Pavone. Advanced fluorescence microscopy for in vivo imaging of neuronal activity. Optica, 6, 758(2019).
[6] B. A. Wilt, L. D. Burns, E. T. Wei Ho, K. K. Ghosh, E. A. Mukamel, M. J. Schnitzer. Advances in light microscopy for neuroscience. Annu. Rev. Neurosci., 32, 435(2009).
[7] I. Y. Koh, W. B. Lindquist, K. Zito, E. A. Nimchinsky, K. Svoboda. An image analysis algorithm for dendritic spines. Neural. Comput., 14, 1283(2002).
[8] M. U. Ghani, F. Mesadi, S. D. Kanık, A. O. Argunsah, A. F. Hobbiss, I. Israely, D. Unay, T. Tasdizen, M. Cetin. Dendritic spine classification using shape and appearance features based on two-photon microscopy. J. Neurosci. Methods, 279, 13(2017).
[9] M. Li, F. Liu, H. Jiang, T. S. Lee, S. Tang. Long-term two-photon imaging in awake macaque monkey. Neuron, 93, 1049(2017).
[10] Z. Gu, X. Wang, J. Wang, F. Fan, S. Chang. Sidelobe suppression and axial resolution enhancement in 4pi microscopy with higher-order radially polarized Laguerre–Gaussian beams using subtractive imaging. Chin. Opt. Lett., 17, 121103(2019).
[11] J. Zeng, P. Mahou, M.-C. Schanne-Klein, E. Beaurepaire, D. Débarre. 3D resolved mapping of optical aberrations in thick tissues. Biomed. Opt. Express, 3, 1898(2012).
[12] M. J. Booth. Adaptive optics in microscopy. Philos. Trans. A Math. Phys. Eng. Sci., 365, 2829(2007).
[13] F. Helmchen, W. Denk. Deep tissue two-photon microscopy. Nat. Methods, 2, 932(2005).
[14] W. Denk, J. H. Strickler, W. W. Webb. Two-photon laser scanning fluorescence microscopy. Science, 248, 73(1990).
[15] K. Svoboda, R. Yasuda. Principles of two-photon excitation microscopy and its applications to neuroscience. Neuron, 50, 823(2006).
[16] C. Jin, L. Kong, H. Dana, H. Xie, L. Cao, G. Jin, Q. Dai. Advances in point spread function engineering for functional imaging of neural circuits in vivo. J. Phys. D, 53, 383001(2020).
[17] Y. Liu, P. Lai, C. Ma, X. Xu, A. A. Grabar, L. V. Wang. Optical focusing deep inside dynamic scattering media with near-infrared time-reversed ultrasonically encoded (TRUE) light. Nat. Commun., 6, 5904(2015).
[18] R. Horstmeyer, H. Ruan, C. Yang. Guidestar-assisted wavefront-shaping methods for focusing light into biological tissue. Nat. Photon., 9, 563(2015).
[19] N. Ji. Adaptive optical fluorescence microscopy. Nat. Methods, 14, 374(2017).
[20] L. Kong, M. Cui. In vivo deep tissue imaging via iterative multiphoton adaptive compensation technique. IEEE J. Sel. Top. Quantum Electron., 22, 40(2016).
[21] J.-H. Park, W. Sun, M. Cui. High-resolution in vivo imaging of mouse brain through the intact skull. Proc. Natl. Acad. Sci. U.S.A., 112, 9236(2015).
[22] J.-H. Park, L. Kong, Y. Zhou, M. Cui. Large-field-of-view imaging by multi-pupil adaptive optics. Nat. Methods, 14, 581(2017).
[23] P. T. So, C. Y. Dong, B. R. Masters, K. M. Berland. Two-photon excitation fluorescence microscopy. Annu. Rev. Biomed. Eng., 2, 399(2000).
[24] B. Richards, E. Wolf. Electromagnetic diffraction in optical systems. II. Structure of the image field in an aplanatic system. Proc. Roy. Soc. A, 253, 358(1959).
[25] Q. Li. Optimization of point spread function of a high numerical aperture objective lens: application to high resolution optical imaging and fabrication(2014).
[26] M. Born, E. Wolf. Principles of Optics: Electromagnetic Theory of Propagation, Interference and Diffraction of Light(1999).
[27] M. A. Neil, M. J. Booth, T. Wilson. New modal wave-front sensor: a theoretical analysis. J. Opt. Soc. Am. A, 17, 1098(2000).
[28] S. L. Jacques. Optical properties of biological tissues: a review. Phys. Med. Biol., 58, R37(2013).
[29] B. Huang, W. Wang, M. Bates, X. Zhuang. Three-dimensional super-resolution imaging by stochastic optical reconstruction microscopy. Science, 319, 810(2008).
[30] M. Tobias, B. A. Gutwein, A. Rohrbach. Light-sheet microscopy in a glass capillary: feedback holographic control for illumination beam correction. Opt. Lett., 42, 350(2017).
[31] R. Turcotte, Y. Liang, N. Ji. Adaptive optical versus spherical aberration corrections for in vivo brain imaging. Biomed. Opt. Express, 8, 3891(2017).


Set citation alerts for the article
Please enter your email address

© Copyright 2018-2021 | Chinese Laser Press. All Rights Reserved 沪ICP备15018463号-20