
Qi Wu, Yanguo Fan, Bowen Fan, Dingfeng Yu. Graph Regularized Low-Rank and Collaborative Representation for Hyperspectral Anomaly Detection[J]. Laser & Optoelectronics Progress, 2022, 59(12): 1228003
- Laser & Optoelectronics Progress
- Vol. 59, Issue 12, 1228003 (2022)
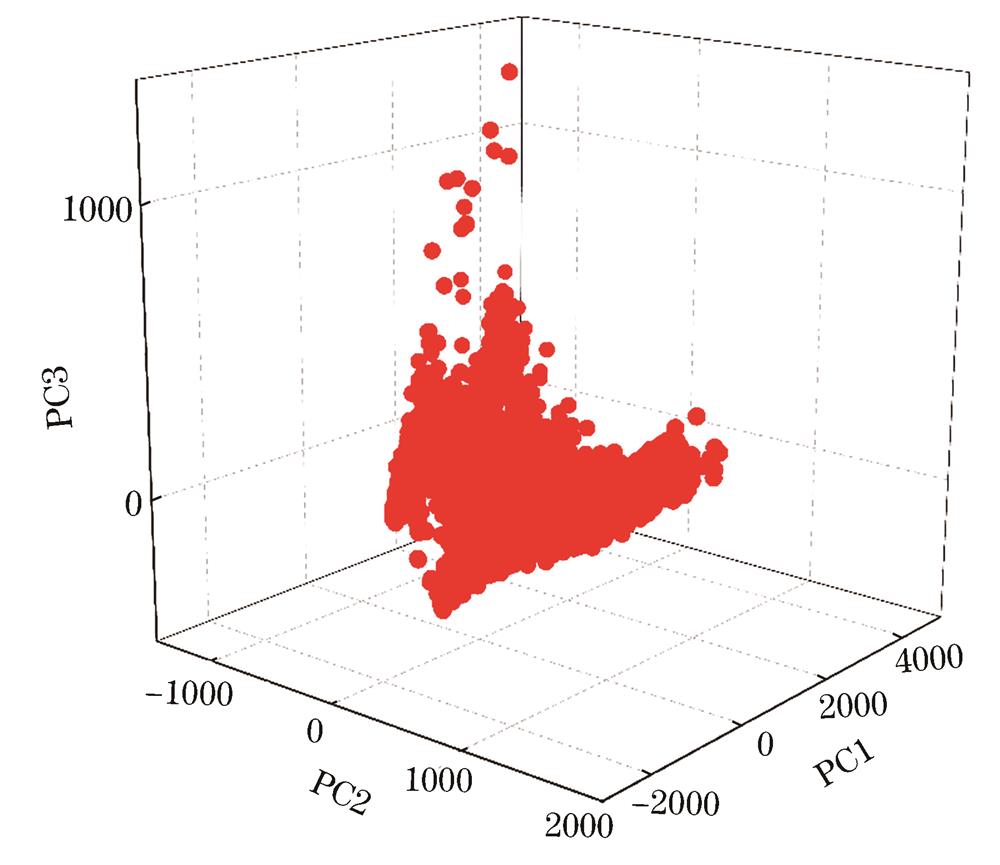
Fig. 1. Scatter plot of all the pixels in HYDICE data set
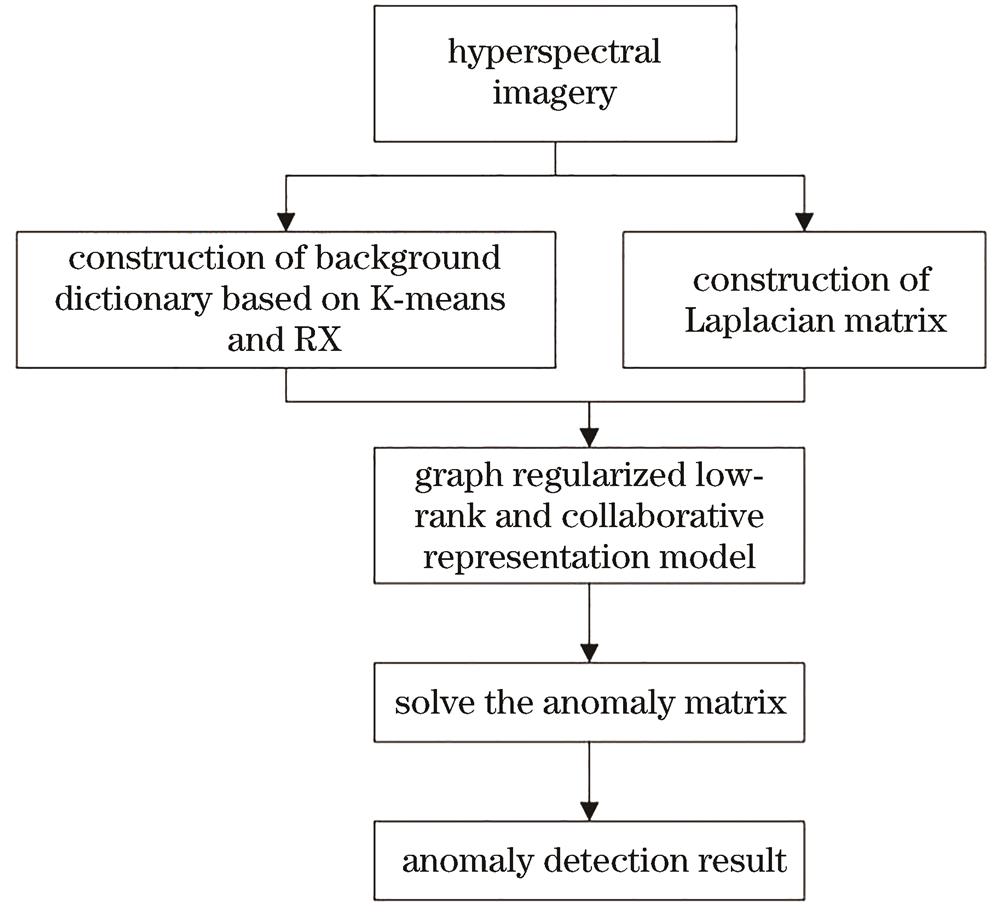
Fig. 2. Flow chart of hyperspectral anomaly detection based on graph regularized low-rank and collaborative representation
Fig. 3. Analysis of endmember number on three datasets. (a) Simulated dataset; (b) HYDICE dataset; (c) Gulfport dataset
Fig. 4. Hyperspectral synthetic dataset. (a) Original image of the study area; (b) false-color image of simulated dataset; (c) ground-truth map
Fig. 5. HYDICE dataset. (a) Whole image scene; (b) false-color image of the selected region; (c) ground-truth map
Fig. 6. Gulfport dataset. (a) False-color image; (b) ground-truth map
Fig. 7. Detection accuracy of GLRCRD on the simulated dataset under different parameters. (a)
Fig. 8. Detection results obtained by six algorithms on the simulated dataset. (a) RX; (b) CRD; (c) LRASR; (d) LSMAD;(e) LRCRD; (f) GLRCRD
Fig. 9. Detection results obtained by six slgorithms on the HYDICE dataset. (a) RX; (b) CRD; (c) LRASR;(d) LSMAD; (e) LRCRD; (f) GLRCRD
Fig. 10. Detection results obtained by six algorithms on the Gulfport dataset. (a) RX; (b) CRD; (c) LRASR; (d) LSMAD; (e) LRCRD; (f) GLRCRD
Fig. 11. ROC curves obtained by six algorithms. (a) Simulated dataset; (b) HYDICE dataset; (c) Gulfport dataset
|
Table 1. AUC values obtained by different anomaly detection algorithms
|
Table 2. Computation time of different anomaly detection algorithms

Set citation alerts for the article
Please enter your email address
© Copyright 2018-2021 | Chinese Laser Press. All Rights Reserved 沪ICP备15018463号-20