• Chinese Journal of Lasers
  • Vol. 47, Issue 2, 207023 (2020)
Zhang Xinxin1、2、3, He Mingxia1、2、3、*, Zhao Jinwu1、2、3, Chen Xieyu1、3, Liu Liyuan1、3, Lu Xiaoyun4, Tian Tian1、2、3, Chen Mengqiu1、2、3, and Wang Pu1、2、3
Author Affiliations
  • 1School of Precision Instrument & Opto-Electronics Engineering, Tianjin University, Tianjin 300072, China
  • 2State Key Laboratory of Precision Measurement Technology and Instruments, Tianjin University, Tianjin 300072, China
  • 3Terahertz Research Center, Tianjin University, Tianjin 300072, China
  • 4College of Life Science and Technology, Xi''an Jiaotong University, Xi''an, Shaanxi 710048, China
  • show less
    DOI: 10.3788/CJL202047.0207023 Cite this Article Set citation alerts
    Zhang Xinxin, He Mingxia, Zhao Jinwu, Chen Xieyu, Liu Liyuan, Lu Xiaoyun, Tian Tian, Chen Mengqiu, Wang Pu. Effect of 0.1 THz Radiation on Excitability of Hippocampal Neurons in Sprague Dawley Rats[J]. Chinese Journal of Lasers, 2020, 47(2): 207023 Copy Citation Text show less
    Schematic of THz radiation system
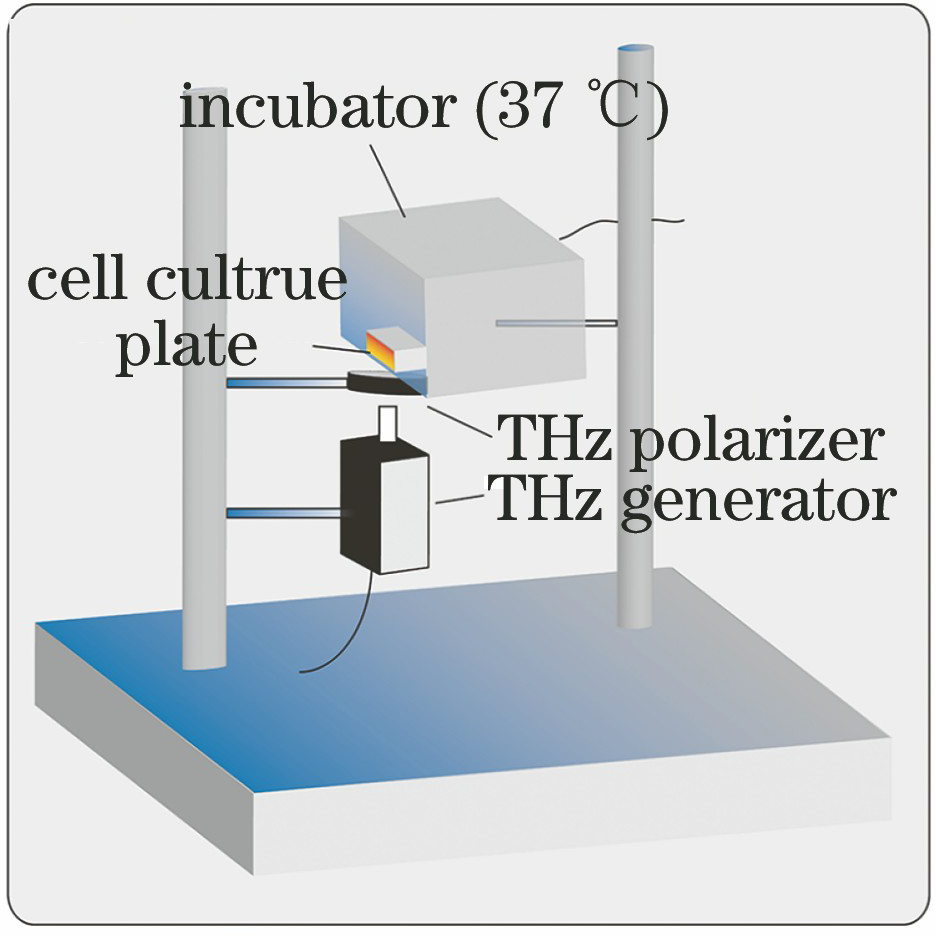
    Fig. 1. Schematic of THz radiation system
    Power diagrams of THz wave. (a) 88 mW; (b) 3 mW
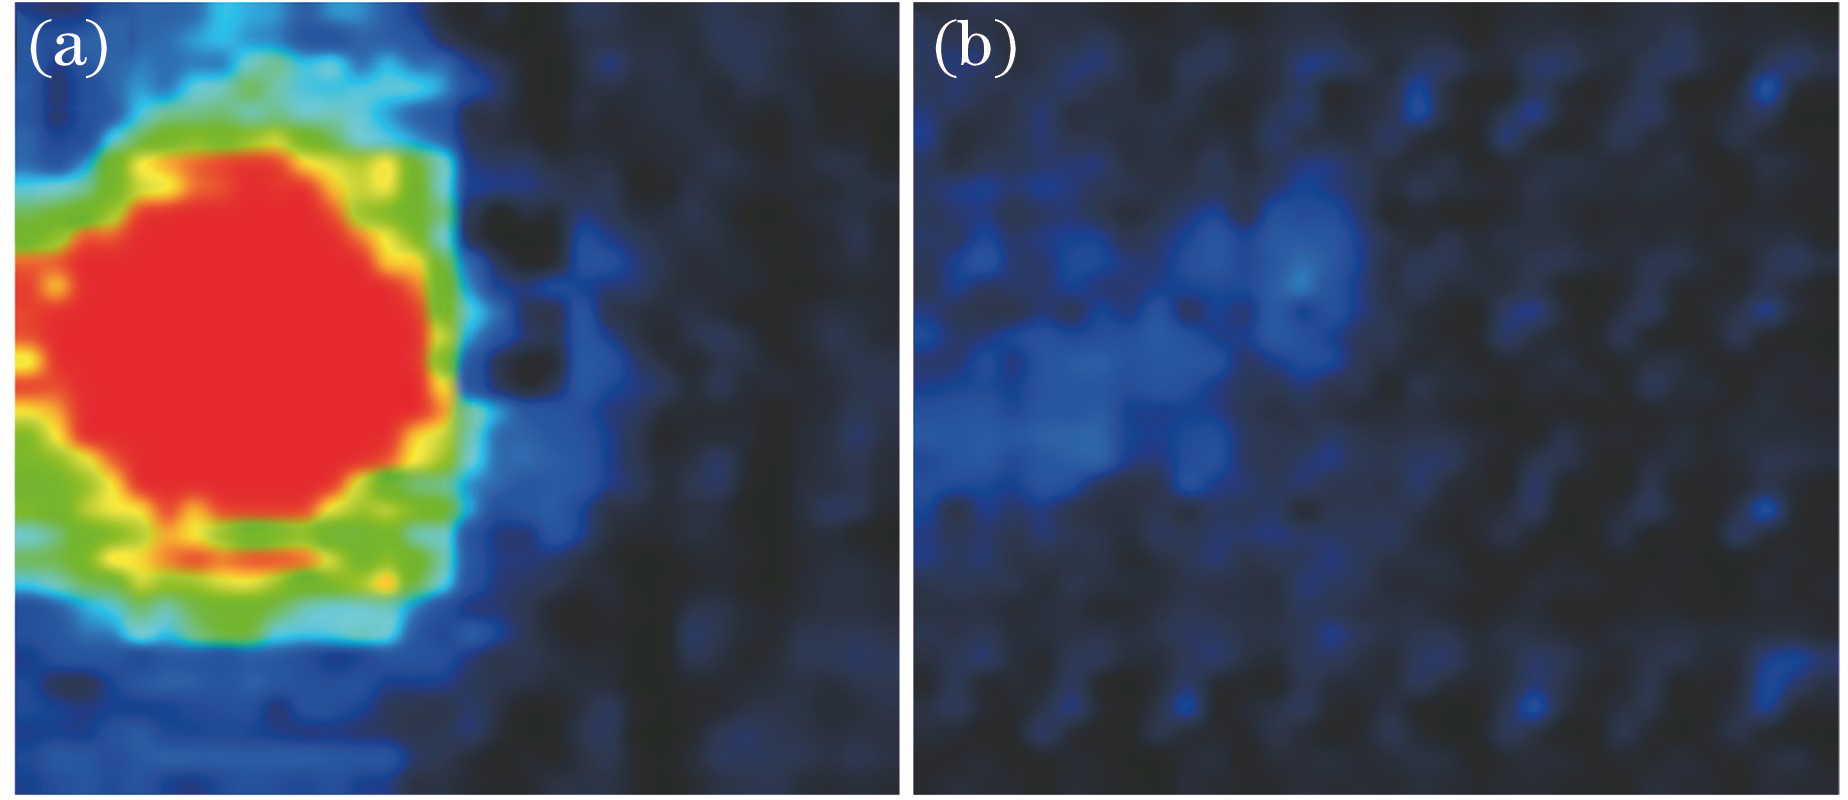
    Fig. 2. Power diagrams of THz wave. (a) 88 mW; (b) 3 mW
    Test results of neuronal membrane potential with different radiation time (the first row is control group, and the second row is experimental group). (a) 5 min; (b) 15 min; (c) 25 min; (d) distribution of relative fluorescence intensity for three repeated experiments
    Fig. 3. Test results of neuronal membrane potential with different radiation time (the first row is control group, and the second row is experimental group). (a) 5 min; (b) 15 min; (c) 25 min; (d) distribution of relative fluorescence intensity for three repeated experiments
    Test results of intracellular calcium ion concentration after irradiation for different time (the first row is control group, and the second row is experimental group). (a) 5 min; (b) 15 min; (c) 25 min; (d) distribution of relative fluorescence intensity of calcium ion concentration in three repeated experiments
    Fig. 4. Test results of intracellular calcium ion concentration after irradiation for different time (the first row is control group, and the second row is experimental group). (a) 5 min; (b) 15 min; (c) 25 min; (d) distribution of relative fluorescence intensity of calcium ion concentration in three repeated experiments
    Test results of intracellular sodium ion concentration after irradiation for different time (the first row is control group, and the second row is experimental group). (a) 5 min; (b) 15 min; (c) 25 min; (d) distribution of relative fluorescence intensity of sodium ion concentration in three repeated experiments
    Fig. 5. Test results of intracellular sodium ion concentration after irradiation for different time (the first row is control group, and the second row is experimental group). (a) 5 min; (b) 15 min; (c) 25 min; (d) distribution of relative fluorescence intensity of sodium ion concentration in three repeated experiments
    Test results of intracellular potassium ion concentration after irradiation for different time (the first row is control group, and the second row is experimental group). (a) 5 min; (b) 15 min; (c) 25 min; (d) distribution of relative fluorescence intensity of potassium ion concentration in three repeated experiments
    Fig. 6. Test results of intracellular potassium ion concentration after irradiation for different time (the first row is control group, and the second row is experimental group). (a) 5 min; (b) 15 min; (c) 25 min; (d) distribution of relative fluorescence intensity of potassium ion concentration in three repeated experiments
    Item5 min radiation15 min radiation25 min radiation
    No.1No.2No.3No.1No.2No.3No.1No.2No.3
    Membranepotential0.13340.6014≪0.010.00980.0086≪0.010.01660.00040.0113
    Ca2+ concentration0.62280.0024≪0.010.0009≪0.01≪0.010.00130.00050.009
    Na+ concentration0.00170.75620.04460.02560.00620.0070≪0.010.04670.0188
    K+ concentration≪0.01≪0.010.03680.0189≪0.010.0164≪0.01≪0.01≪0.01
    Table 1. Significance of difference between control group and experimental group (No. 1,No. 2, and No. 3 represent the first, second, and third experiments)
    Zhang Xinxin, He Mingxia, Zhao Jinwu, Chen Xieyu, Liu Liyuan, Lu Xiaoyun, Tian Tian, Chen Mengqiu, Wang Pu. Effect of 0.1 THz Radiation on Excitability of Hippocampal Neurons in Sprague Dawley Rats[J]. Chinese Journal of Lasers, 2020, 47(2): 207023
    Download Citation