
Jian Zhang, Rui Tu, Chao Huang, Xiaoli Yao, Xin Hu, Haixiong Ge, Xuefeng Zhang, "Chiral plasmonic nanostructure of twistedly stacked nanogaps," Chin. Opt. Lett. 19, 013601 (2021)
- Chinese Optics Letters
- Vol. 19, Issue 1, 013601 (2021)
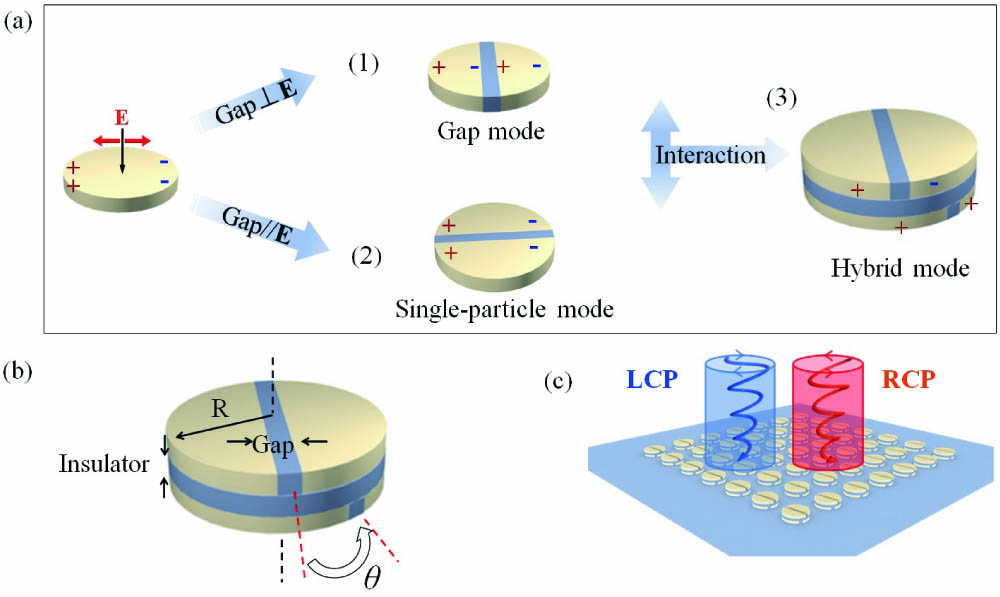
Fig. 1. Schematic diagram of structural model proposed in this study. (a) The formation of the hybrid mode. (b) The twistedly and vertically aligned MIM structure realized with the rotation of θ. (c) The proposed periodic array of the MIM structure with LCP and RCP plane waves.
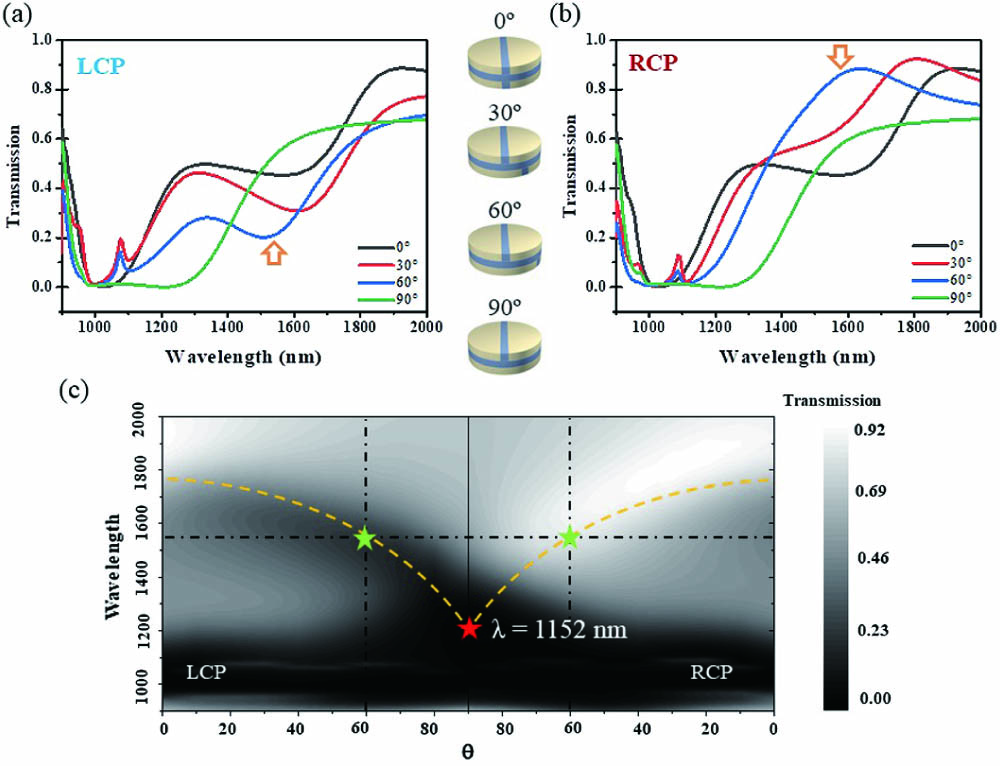
Fig. 2. Transmission spectra of MIM structures for (a) LCP and (b) RCP plane waves with different twisted angles at 0o, 30o, 60o, and 90o, respectively. (c) The detailed transmission spectra of the MIM structure with twisted angles
Fig. 3. Simulated charge distributions of the top and bottom nanogaps twistedly stacked with (a) 0o, (b) 90o, (c) 30o, and (d) 60o, excited with LCP and RCP plane waves at the wavelength of 1550 nm, respectively. Simple drawing for charge oscillations of the same structures with the twisted angle of (e) 0o, (f) 90o, (g) 30o, and (h) 60o, excited with LCP and RCP plane waves at the wavelength of 1550 nm, respectively. Inset in (h): SP mode and gap mode for the same structure with LCP and RCP plane waves, respectively.
Fig. 4. Calculated magnetic near-field distributions of top and bottom nanogaps twistedly stacked with (a) 0°, (b) 90°, (c) 30°, and (d) 60°, excited with LCP and RCP plane waves at the wavelength of 1550 nm, respectively.
Fig. 5. CD signals of the MIM structure impacted by twisted angles varied from 0° to 90°. (a)
Fig. 6. (a) Maximum of CD (


Set citation alerts for the article
Please enter your email address

© Copyright 2018-2021 | Chinese Laser Press. All Rights Reserved 沪ICP备15018463号-20