
Wei-Tao Han, Peng Yi, Hai-Long Ma, Peng Zhang, Le Tian. Robustness of interdependent networks withheterogeneous weak inter-layer links [J]. Acta Physica Sinica, 2019, 68(18): 186401-1
- Acta Physica Sinica
- Vol. 68, Issue 18, 186401-1 (2019)
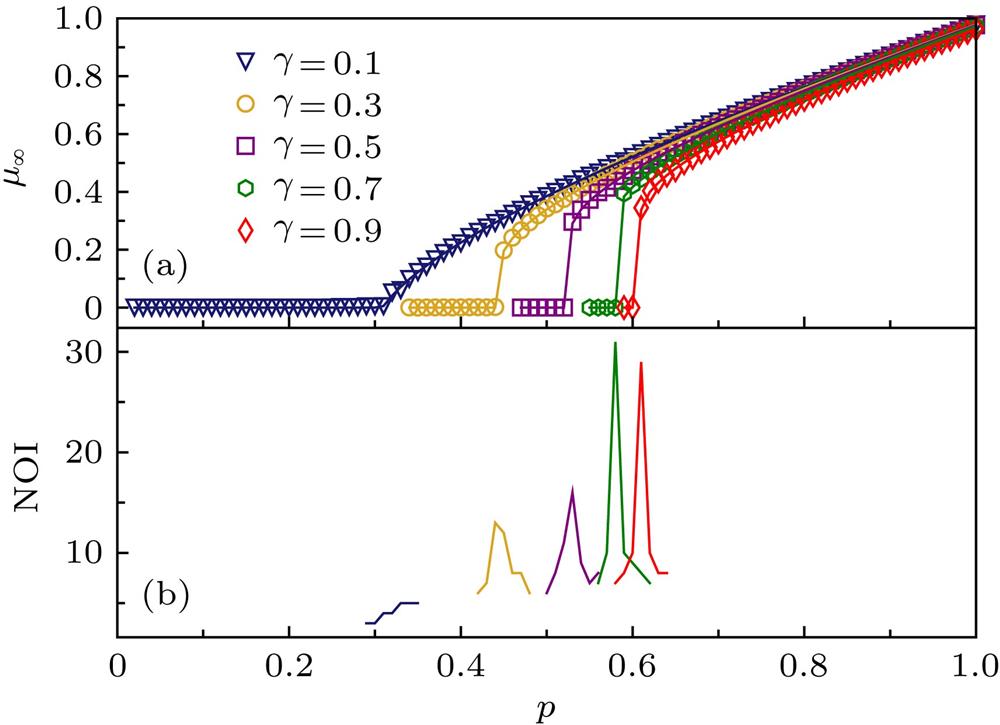
Fig. 1. Simulation results of
versus p for homogeneous symmetric interdependent ER networks for different γ (each network has 200000 nodes, average degree is 4). (a) The size of the giant component
versus p . The symbols represent the simulation results, and the solid lines show the corresponding analytical predictions of Eqs. (17 ) and (18 ). (b) Number of iterative failures.
同质对称ER弱相依网络对于不同γ 值的巨分量
与p 对应关系(网络节点数为200000, 平均度为4) (a) 巨分量大小
与p 对应关系, 空心标记表示仿真结果, 实线是根据(17 )和(18 )式得到的理论值; (b) 级联失效迭代次数
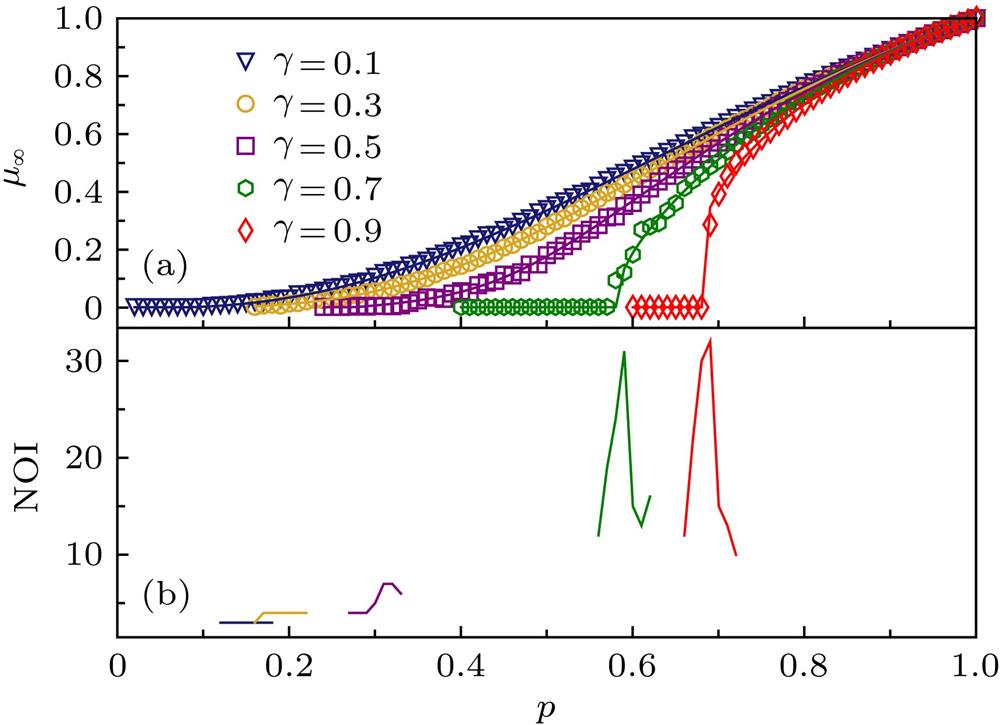
Fig. 2. Simulation results of
versus p for homogeneous symmetric interdependent SF networks for different γ (each network has 200000 nodes, average degree is 4,
). (a) The size of the giant component
versus p . The symbols represent the simulation results, and the solid lines show the corresponding analytical predictions of Eqs. (17 ) and (18 ). (b) Number of iterative failures.
同质对称SF弱相依网络对于不同
的巨分量
与p 对应关系(网络节点数为20000, 平均度为4,
) (a) 巨分量大小
与p 对应关系, 空心标记表示仿真结果, 实线是根据(17 )式和(18 )式得到的理论值; (b) 级联失效迭代次数
Fig. 3. Graphical solutions of homogeneous symmetric interdependent ER networks percolation transition for different γ : (a) γ = 0.1; (b) γ = 0.4. The average degree is 4. At the transition point p c, the curve of D (f ) tangents to f axis.
同质对称ER弱相依网络对于不同γ 值的数值解示意图(网络平均度为4; 在相变点p c处,
曲线与f 轴相切) (a) γ = 0.1; (b) γ = 0.4
Fig. 4. Graphical solutions of homogeneous symmetric interdependent SF networks percolation transition for different γ : (a) γ = 0.5; (b) γ = 0.9. The average degree is 4,
. At the transition point p c, the curve of D (f ) tangents to f axis.
同质对称SF弱相依网络对于不同γ 值的数值解示意图(网络平均度为4,
; 在相变点p c处,
曲线与f 轴相切) (a) γ = 0.5; (b) γ = 0.9
Fig. 5. Simulation results of p c versus γ for homogeneous symmetric interdependent ER networks with different
, each network has 200000 nodes. The symbols represent the simulation results. The corresponding analytical predictions are shown by lines, solid lines and dashed lines represent continuous and discontinuous phase transitions, respectively. The vertical dotted line is the boundary of continuous and discontinuous regions.
不同平均度同质对称ER弱相依网络相变点p c与γ 对应关系, 其中网络的节点数为200000; 空心标记为仿真结果; 理论值分别通过实线和短划线表示, 其中实线为连续相变, 短划线为非连续相变; 垂直的点状线为连续相变和非连续相变的边界
Fig. 6. Simulation results of heterogeneous and homogeneous symmetric ER interdependent networks with different γ distributions, each network has 200000 nodes, average degree is 4,
. The symbols represent the simulation results, and the solid lines show the corresponding analytical predictions.
不同简单γ 分布的同质和异质ER弱相依网络的仿真结果, 其中网络节点数为200000, 平均度是4,
; 空心标记表示仿真结果, 实线是理论分析值
Fig. 7. Simulation results of critical point
of simple heterogeneous symmetric ER interdependent networks versus
, each network has 200000 nodes, average degree is 4,
. The symbols represent the simulation results. The corresponding analytical predictions are shown by lines, solid lines and dashed lines represent continuous and discontinuous phase transitions, respectively. The dotted line is the boundary of continuous and discontinuous regions.
简单γ分布异质对称ER弱相依网络相变点
与
值的仿真结果, 其中网络节点数为200000, 平均度是4,
; 空心标记表示仿真值, 短划线和实线分别表示非连续相变与连续相变的理论值, 点状线是连续相变和非连续相变的分界线
Fig. 8. Simulation results of
versus p for heterogeneous symmetric ER interdependent networks with Gaussian distributions of connectivity link failure probability. The average value
are set as 0.7,
are set as 0.9, 0.4, 0.2, respectively. According to Eq. (25 ),
when
. The symbols represent the simulation results, and the solid lines show the corresponding analytical predictions.
连接边失效概率服从高斯分布的异质对称ER弱相依网络巨分量
与p 的对应关系, 其中高斯分布的均值
为0.7,
分别为0.9, 0.4, 0.2; 根据(25 )式,
时
; 空心标记为仿真结果, 实线为理论分析值

Set citation alerts for the article
Please enter your email address
© Copyright 2018-2021 | Chinese Laser Press. All Rights Reserved 沪ICP备15018463号-20