• Laser & Optoelectronics Progress
  • Vol. 57, Issue 8, 081008 (2020)
Yang Xue, Haidong Wu*, Ning Zhang, Zhicheng Yu, Xiaokang Ye, and Xi Hua
Author Affiliations
  • School of Automation Engineering, Shanghai University of Electric Power, Shanghai 200090, China
  • show less
    DOI: 10.3788/LOP57.081008 Cite this Article Set citation alerts
    Yang Xue, Haidong Wu, Ning Zhang, Zhicheng Yu, Xiaokang Ye, Xi Hua. Detection of Insulation Piercing Connectors and Bolts on the Transmission Line Using Improved Faster R-CNN[J]. Laser & Optoelectronics Progress, 2020, 57(8): 081008 Copy Citation Text show less
    Faster R-CNN model for detecting images of insulation piercing connectors and bolts
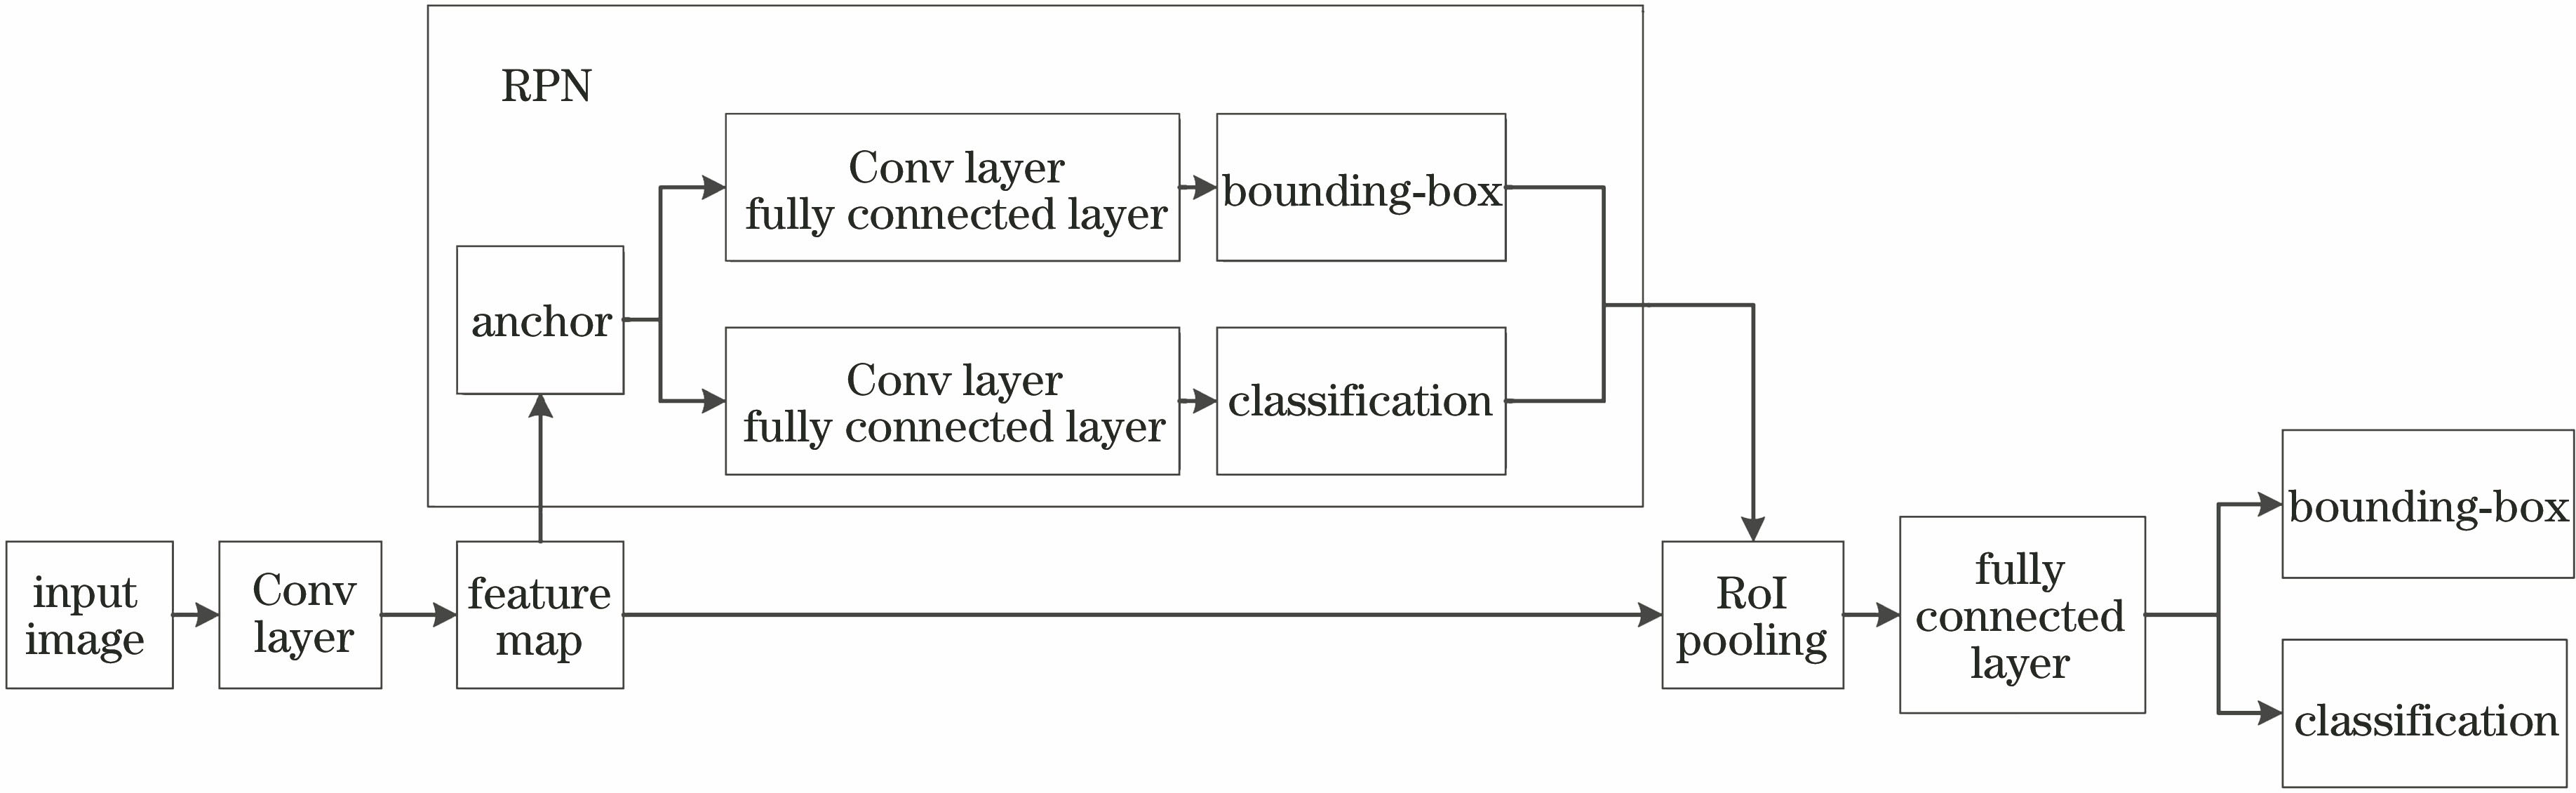
    Fig. 1. Faster R-CNN model for detecting images of insulation piercing connectors and bolts
    RPN model
    Fig. 2. RPN model
    Anchors of different scales and lengths
    Fig. 3. Anchors of different scales and lengths
    RoI pooling network
    Fig. 4. RoI pooling network
    Model structure diagram. (a) Faster R-CNN model; (b) improved Faster R-CNN model
    Fig. 5. Model structure diagram. (a) Faster R-CNN model; (b) improved Faster R-CNN model
    Residual block structure diagram of ResNet
    Fig. 6. Residual block structure diagram of ResNet
    Detection results of improved Faster R-CNN model for connectors and bolts under different conditions. (a) Vertically inward bolt; (b) downward bolt; (c) upward bolt; (d) bolt shielded by its own wire clip
    Fig. 7. Detection results of improved Faster R-CNN model for connectors and bolts under different conditions. (a) Vertically inward bolt; (b) downward bolt; (c) upward bolt; (d) bolt shielded by its own wire clip
    Detection network structure of insulation piercing connectors and bolts on the transmission line based on improved Faster R-CNN
    Fig. 8. Detection network structure of insulation piercing connectors and bolts on the transmission line based on improved Faster R-CNN
    Detection flow chart of insulation piercing connectors and bolts on the transmission line based on improved Faster R-CNN
    Fig. 9. Detection flow chart of insulation piercing connectors and bolts on the transmission line based on improved Faster R-CNN
    Number ofimagesAP of insulationpiercing connector /%AP ofbolt/%mAP /%
    150091.890.291.0
    300093.391.592.4
    Table 1. Comparison of results obtained from different training sample amount
    ModelAP of insulationpiercingconnector /%AP ofbolt /%mAP /%
    Faster R-CNN+ZFNet88.286.487.3
    Faster R-CNN+VGG-1690.388.989.6
    Faster R-CNN+ResNet5093.391.592.4
    Table 2. Comparison of Faster R-CNN model results based on three different networks
    ModelNumber ofproposalsBatch size inRPN stageBatch size in 2nd stagemAP /%
    3001286492.4
    Faster R-CNN+ResNet502501286491.1
    2001286490.3
    1501286488.5
    Table 3. Comparison of effects of different number of proposals after first stage NMS on mAP
    ModelNumber ofproposalsBatch sizein RPN stageBatch size in 2nd stagemAP /%
    3001286492.4
    Faster R-CNN+ResNet50300643291.6
    300321689.4
    Table 4. Comparison of effects of different batch sizes on mAP
    ModelAP of insulationpiercing connector /%AP of bolt/%mAP /%Time per image /ms
    Faster R-CNN+ResNet5093.391.592.42639
    SSD84.580.382.368
    YOLO v385.683.584.644
    Table 5. Comparison of effects of different object detection models on mAP
    Yang Xue, Haidong Wu, Ning Zhang, Zhicheng Yu, Xiaokang Ye, Xi Hua. Detection of Insulation Piercing Connectors and Bolts on the Transmission Line Using Improved Faster R-CNN[J]. Laser & Optoelectronics Progress, 2020, 57(8): 081008
    Download Citation