
Li Su, Kaiwen Song, Peitong Lv, Haoran Wang, Mingyang Sun, Xiaotong Zhang, Tianyu Zhang. Optical coherence tomography technology for diagnosis of diseases in organs[J]. Infrared and Laser Engineering, 2022, 51(10): 20210803
- Infrared and Laser Engineering
- Vol. 51, Issue 10, 20210803 (2022)
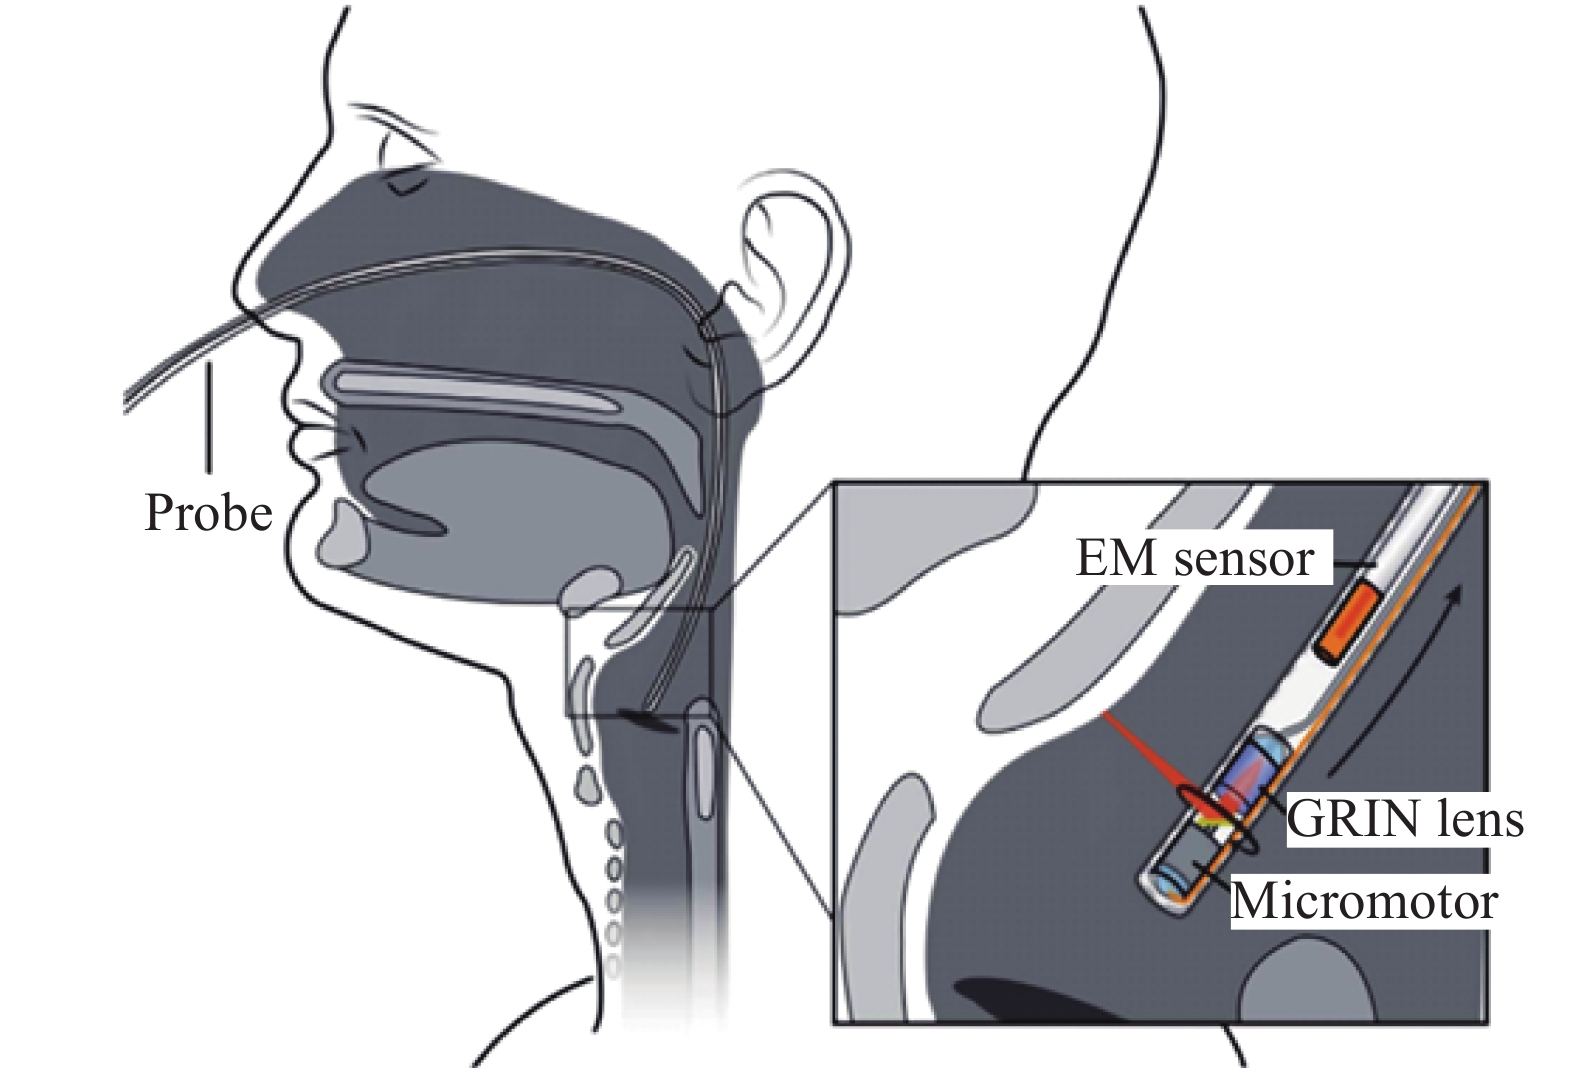
Fig. 1. LR-OCT imaging of the upper airway
![Preoperative axial OCT image of the nasopharynx and adenoids of a 7 year old male patient (left image). Postoperative axial OCT image of the nasopharynx of the same patient (right image)(Note: The adenoids have been removed and the airway lumen is larger[15])](/richHtml/irla/2022/51/10/20210803/img_2.jpg)
Fig. 2. Preoperative axial OCT image of the nasopharynx and adenoids of a 7 year old male patient (left image). Postoperative axial OCT image of the nasopharynx of the same patient (right image)(Note: The adenoids have been removed and the airway lumen is larger[15])
Fig. 3. Six in vivo measurements of the airway (and esophagus) of a human and arranged by distance in the airway: (a) nasal cavity, (b) nasopharynx, (c) velopharynx, (d) oropharynx, (e) hypopharynx, and (f) esophagus. (Note the following anatomical features: nasal septum (N), middle turbinate (MT), inferior turbinate (IT), posterior nasal spine (P), base of uvula (BU), base of tongue (BT), and arytenoid cartilage (AC). The two circles at the center of the images are the reflections from the inner and outer surfaces of the catheter[1])
Fig. 4. Various anatomic landmarks and regions of the pharynx from the upper esophagus and completed in one nostril[16]
Fig. 5. (a)–(c) aOCT images of swine trachea displayed in three different viewing angles; (d)–(f) Corresponding CT images; (g) Photograph of the swine airway. (Note: The imaged region is indicated by the dotted square. The x , y , and z scale bars each represent 3 mm)
Fig. 6. Intraoperative FD-OCT of the pediatric airway. Note: A 0.7 mm OD OCT probe (75–80 cm length) is connected to a combined rotational motor and dual-motor stage for linear pullback. The probe, housed in a transparent fluorinated ethylene propylene sheath, is inserted through a Y-connector and pushed inside the endotracheal tube. The combined motors simultaneously rotate and retract the probe through the upper airway as the OCT signal is reflected at 90o into the tissue. ETT = endotracheal tube[19]
Fig. 7. OCT image of pediatric subglottis represented in (A) polar coordinates and (B) cropped segment of Cartesian coordinates. (Note: A: anterior, C: cricoid cartilage, E: epithelium, BM: basement membrane, LP: lamina propria, PC: perichondrium, double arrows: probe sheath, and single arrow: endotracheal tube inner/outer wall. Bar = 500 mm[19])
Fig. 8. (a) In vivo OCT image of a normal rabbit airway, (b) and (c) histology, and (d) an image of the airway taken by a bronchoscope. (Note: e: epithelium, m: mucosa, c: cartilage, BV: blood vessel, PBT: peri bronchial tissue, and tm: muscularis[24])
Fig. 9. (A) Anatomy of a healthy human airway with its characteristic multilayered profile, (B) Cross-section OCT images in the following anatomic components: Epithelium (E), lamina propria (LP), smooth muscle (SM), mucus glands (G), and cartilage(C)
Fig. 10. Enface OCT image of the buccal mucosa: (a) healthy tissue and (b) oral squamous cell carcinoma[38]
Fig. 11. Typical OCT images of (a) healthy and (b) nephritic kidneys[42]
Fig. 12. (a) OCT structure image of the mouse brain. [Note: The two red circles indicate that the leftmost and rightmost ends have the maximum and minimum brightness, respectively. The two longitudinal curves next to (a) indicate the signal intensity of the leftmost and rightmost A-scans of (a).) (b) OCT blood flow image of (a). (c) En face MIP image of (b). (Note: The red line represents the locations of (a) and (b).] (d) Segmentation result of the Otsu method. (e) Common threshold segmentation. (Note: The two yellow boxes in (d) and (e) indicate capillaries with relatively lower intensity[43]]
Fig. 13. Ex vivo histology and OCT slice depicting the same vessel part with varying shapes[44]
Fig. 14. (a) Schematic of the SD-OCT setup; (Note: Red arrows depict the optical beam scan pattern for 3 D imaging of the sample, where m: mirror, gm: galvanometer mounted mirror, gr: grating, lsc: line scan camera.)(b) Two-dimensional OCT sagittal image of in vivo mouse brain, where S: skull, CTX: cerebral cortex, CC: corpus callosum, and scale bar: 0.5 mm; (c) 3D volume of in vivo mouse brain rendered from OCT volumetric scan[48]
Fig. 15. Procedure of the automatic detection algorithm of the skin surface for quantitative analysis of skin roughness. This process includes “curvature estimation” and “surface detection after flattening” procedures[49]
Fig. 16. Cross-sectional OCT images of normal (left) and scarred (right) skin[53]
Fig. 17. Cross-sectional image of normal rat colon ex vivo. (a) Representative cross-sectional OCT image of colon mucosa ex vivo. (b) Representative cross-sectional histology of rat colon tissue. (Note: The red, yellow, and green arrows denote the crypt lumen structures, individual goblet cells, and lamina propria, respectively[57])

Set citation alerts for the article
Please enter your email address
© Copyright 2018-2021 | Chinese Laser Press. All Rights Reserved 沪ICP备15018463号-20