
Fei Wei, Chang Liu, Jun Qiu. Scene Disparity Reconstruction from Light Field Based on Fourier Disparity Layer Representation[J]. Acta Optica Sinica, 2022, 42(16): 1610001
- Acta Optica Sinica
- Vol. 42, Issue 16, 1610001 (2022)
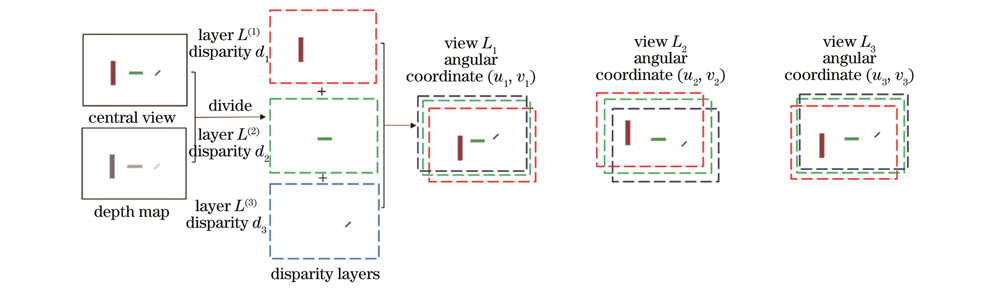
Fig. 1. Schematic diagram for generating new viewpoint diagrams in disparity layers
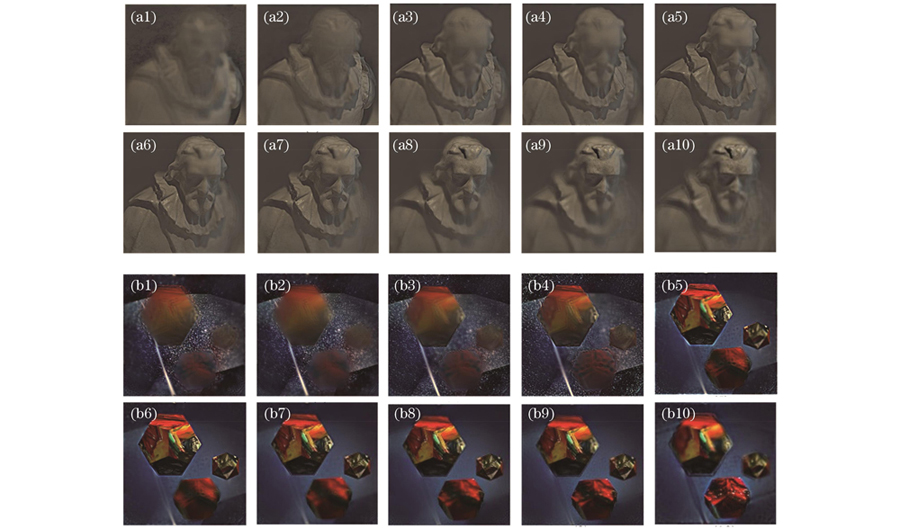
Fig. 2. Disparity layer images of different scenes. (a1)-(a10) cotton scene; (b1)-(b10) platonic scene
Fig. 3. Results of NCC simulation data experiment. (a) Central view image; (b) initial disparity map; (c) filled disparity map; (d) optimized disparity map; (e) ground truth disparity map
Fig. 4. Results of NCC actual data experiment. (a) Central view image; (b) initial disparity map; (c) filled disparity map; (d) optimized disparity map
Fig. 5. Results of cosine simulation data experiment. (a) Central view image; (b) initial disparity map; (c) filled disparity map; (d) optimized disparity map; (e) ground truth disparity map
Fig. 6. Results of cosine actual data experiment. (a) Central view image; (b) initial disparity map; (c) filled disparity map; (d) optimized disparity map
Fig. 7. Disparity profile of scene 1 in horizontal direction. (a) Central view image; (b) disparity profile in initial disparity map; (c) disparity profile in optimized disparity map
Fig. 8. Disparity profile of scene 2 in horizontal direction. (a) Central view image; (b) disparity profile in initial disparity map; (c) disparity profile in optimized disparity map
|
Table 1. Evaluation indexes of disparity map of cotton
|
Table 2. Evaluation indexes of disparity map of platonic

Set citation alerts for the article
Please enter your email address
© Copyright 2018-2021 | Chinese Laser Press. All Rights Reserved 沪ICP备15018463号-20