• Chinese Optics Letters
  • Vol. 16, Issue 11, 113301 (2018)
Yangchun Deng1、2、3, Junlei Zhao1、2, Yun Dai1、2、*, and Yudong Zhang1、2、**
Author Affiliations
  • 1Key Laboratory on Adaptive Optics, Chinese Academy of Sciences, Chengdu 610209, China
  • 2Laboratory on Adaptive Optics, Institute of Optics and Electronics, Chinese Academy of Sciences, Chengdu 610209, China
  • 3University of Chinese Academy of Sciences, Beijing 100049, China
  • show less
    DOI: 10.3788/COL201816.113301 Cite this Article Set citation alerts
    Yangchun Deng, Junlei Zhao, Yun Dai, Yudong Zhang. Objective quantification of chromatic aberration across the visual field of the human eye[J]. Chinese Optics Letters, 2018, 16(11): 113301 Copy Citation Text show less
    Schematic diagram of chromatic aberrations of human eyes. Short wavelength rays are shown by dashed lines, and long wavelength rays are solid lines.
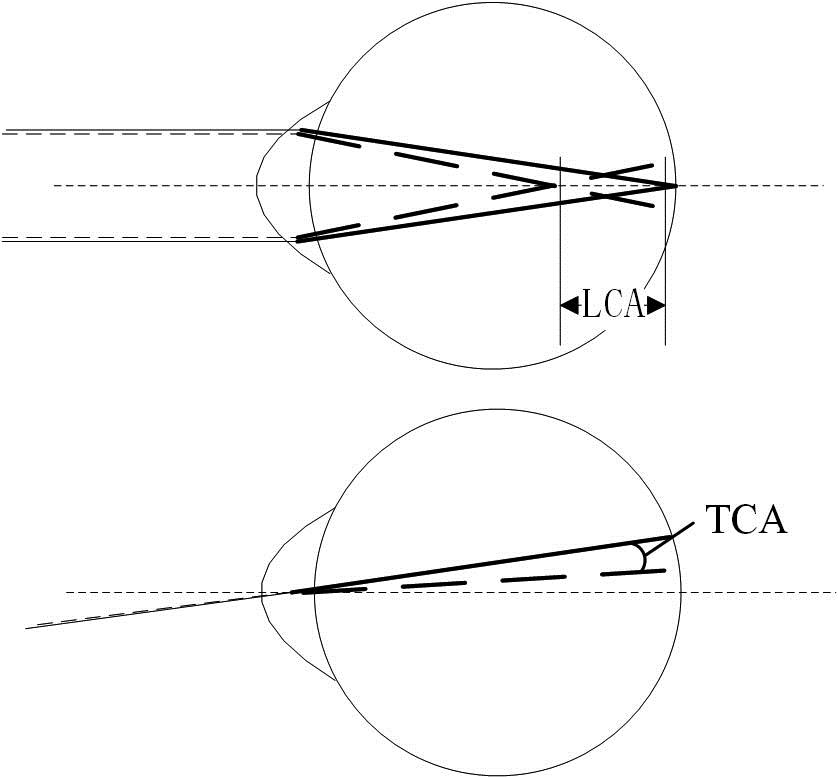
    Fig. 1. Schematic diagram of chromatic aberrations of human eyes. Short wavelength rays are shown by dashed lines, and long wavelength rays are solid lines.
    Schematic diagram of the chromatic aberration measurement system. LD, laser diode; M, mirror; SM, spherical mirror; BS, beam splitter; DM, 145-element PZT deformable mirror; L, lens; AP1, artificial entrance pupil; AP2, artificial exit pupil; F, filter.
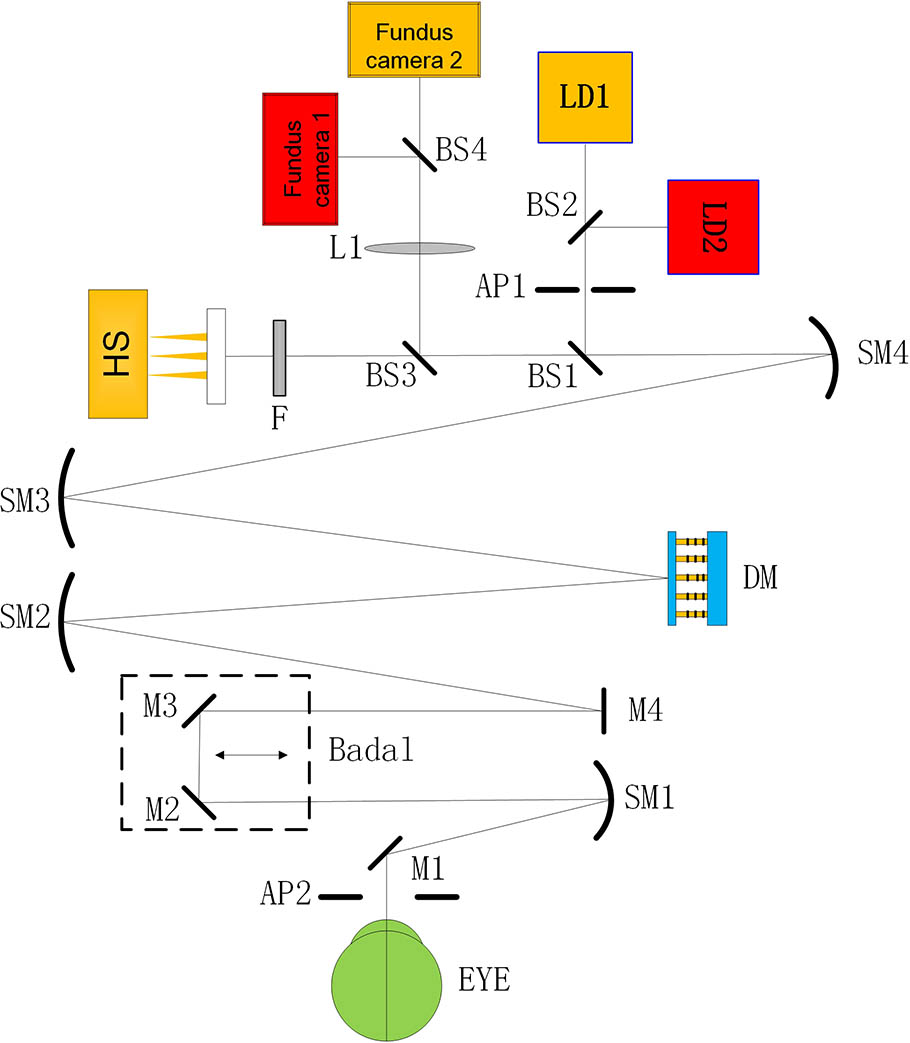
    Fig. 2. Schematic diagram of the chromatic aberration measurement system. LD, laser diode; M, mirror; SM, spherical mirror; BS, beam splitter; DM, 145-element PZT deformable mirror; L, lens; AP1, artificial entrance pupil; AP2, artificial exit pupil; F, filter.
    TCA was calculated from PSF images.
    Fig. 3. TCA was calculated from PSF images.
    Typical PSF images measured at the fovea for the right eyes of five subjects (CH, HSY, ZZ, WZT, and WSQ with aberrations corrected) in red (second line) and near-infrared (first line) wavelengths and the TCA was calculated from PSF images.
    Fig. 4. Typical PSF images measured at the fovea for the right eyes of five subjects (CH, HSY, ZZ, WZT, and WSQ with aberrations corrected) in red (second line) and near-infrared (first line) wavelengths and the TCA was calculated from PSF images.
    TCA in the horizontal meridian for five subjects (A: CH, B: HSY, C: ZZ, D: WZT, E: WSQ). The red squares represent the mean horizontal TCA (hTCA) for each measurement position, while the error bars represent the standard deviations. The red line represents the fitting of the hTCA. The blue circles represent the mean vertical TCA (vTCA). The x coordinate expressed the angle between the visual axis and the measured axis in degrees. The nasal side is negative; the temporal is positive.
    Fig. 5. TCA in the horizontal meridian for five subjects (A: CH, B: HSY, C: ZZ, D: WZT, E: WSQ). The red squares represent the mean horizontal TCA (hTCA) for each measurement position, while the error bars represent the standard deviations. The red line represents the fitting of the hTCA. The blue circles represent the mean vertical TCA (vTCA). The x coordinate expressed the angle between the visual axis and the measured axis in degrees. The nasal side is negative; the temporal is positive.
    LCA in the horizontal meridian for three subjects: black squares (CH), red circles (ZZ), and blue triangles (WZT). The x coordinate expressed the angle between the visual axis and the measured axis in degrees. The nasal side is negative; the temporal is positive.
    Fig. 6. LCA in the horizontal meridian for three subjects: black squares (CH), red circles (ZZ), and blue triangles (WZT). The x coordinate expressed the angle between the visual axis and the measured axis in degrees. The nasal side is negative; the temporal is positive.
    HorizontalCHHSYZZWZTWSQAverage
    10°0.5981.9391.3383.4821.7231.8
    5°0.4461.4161.1092.0401.4341.3
    0.0880.6440.4211.0440.2900.5
    0.4920.2740.1791.9071.5100.8
    10°0.7060.2300.4822.6042.0341.2
    Table 1. HTCA in Five Subjects over the Visual Field
    HorizontalCHZZWZTAverage
    10°0.5380.5480.5410.54
    5°0.4300.4650.4830.46
    0.3610.3970.4120.39
    0.3370.3840.3930.37
    10°0.4050.4460.4500.43
    Table 2. LCA in Three Subjects over the Visual Field
    Yangchun Deng, Junlei Zhao, Yun Dai, Yudong Zhang. Objective quantification of chromatic aberration across the visual field of the human eye[J]. Chinese Optics Letters, 2018, 16(11): 113301
    Download Citation