Yangchun Deng, Junlei Zhao, Yun Dai, Yudong Zhang, "Objective quantification of chromatic aberration across the visual field of the human eye," Chin. Opt. Lett. 16, 113301 (2018)
Copy Citation Text
A simple and straightforward method to objectively measure the transverse chromatic aberration (TCA) at horizontal field angles out to ±10° from the visual axis of the human eye was proposed. Longitudinal chromatic aberration (LCA) was also measured across the visual field. The TCA of a human eye was obtained by deviation of the point spread function (PSF) images. LCA was calculated from the Zernike defocus. The average TCA changing with eccentricity was 0.162 arcmin/degree between 639 nm and 795 nm wavelengths. Near the optic axis of the eye, the average LCA was 0.37 ± 0.02 D, and it increased slightly with eccentricity (up to 0.54 ± 0.02 D).
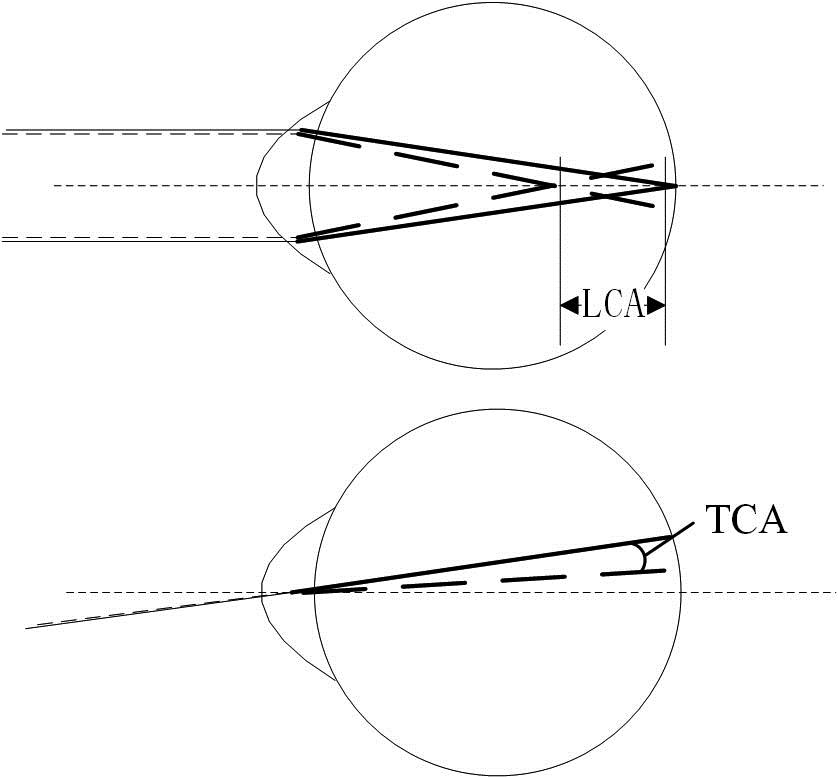
Human eye aberrations are divided into monochromatic aberrations and chromatic aberrations. Chromatic aberrations are divided into longitudinal chromatic aberration (LCA) and transverse chromatic aberration (TCA). LCA is defined as the eye to be relatively more myopic for shorter wavelengths than for longer wavelengths. In contrast, TCA is defined as the angular offset between the chief rays of different wavelengths (Fig. 1)[1]. Hartmann wavefront detection technology has become a well-recognized method for the measurement of monochromatic aberrations[2]. Adaptive optics (AO) has also become an important technique for the correction of human eye monochromatic aberrations[3]. The influence of chromatic aberrations cannot be neglected after correcting monochromatic aberration. Chromatic aberrations affect the resolution of the multiwavelength fundus imaging[4] and reduce the visual function of a human eye with an intraocular lens (IOL)[5,6]. In order to eliminate the negative influence of the chromatic aberrations in multiwavelength imaging and design achromatic IOLs, it is necessary to estimate the chromatic aberrations in a human eye. Several methods were proposed to measure chromatic aberration in a human eye. Each method has advantages and disadvantages. To our knowledge, three main methods of LCA measurement are wavefront sensing, double-pass retinal images, and psychophysical methods[7]. Only two studies of peripheral LCA have previously been reported[8,9]. The common TCA measurement methods are the two-color Vernier-alignment technique[10], spatially resolved refractometer[11], and adaptive optics scanning laser ophthalmoscopy (AOSLO)[12]. The first one, the two-color Vernier-alignment technique, is a simple and subjective method, but subjective judgment influences measurement accuracy, especially on the peripheral field of view with low visual acuity. It is hard to employ the TCA measurement to peripheral vision. The second one, the spatially resolved refractometer method, is an objective method. However, different wavelengths are measured at different times in this method, which inevitably introduces human eye movement errors. As the monochromatic aberration of the peripheral field increases, the TCA in the peripheral field cannot be measured. The last method, AOSLO, can be employed in peripheral TCA measurement when monochromatic aberrations are corrected by an adaptive optics system. It is a simultaneous method for TCA measurements. However, this method was very complex; in order to measure the TCA, the retina should be imaged to reach the precision of cones and then different wavelength cones images need to be analyzed.
Figure 1.Schematic diagram of chromatic aberrations of human eyes. Short wavelength rays are shown by dashed lines, and long wavelength rays are solid lines.
In this Letter, a simple method was proposed based on an objective measurement of the TCA and simultaneous measurement of the LCA over the visual field of the human eye. The TCA of the human eye was obtained by deviation of point spread function (PSF) images at different wavelengths simultaneously. In addition, this method does not need to take photos of fundus cones. LCA was measured as the difference between the Zernike defocus of different wavelengths employed with a Hartmann wavefront sensor.
A measurement system was developed to measure the chromatic aberration. This system was modified by an adaptive optics PSF measurement system[13]. Figure 2 illustrates the chromatic aberration measurement system, which consists of an illumination path, an observation path, and a wavefront sensing path. In the illumination path, near-infrared (795 nm, LD1) and red (639 nm, LD2) light sources were employed. BS2 (and BS4) was a beam splitter that was transparent for near-infrared light and reflected red light. After reflection by a beam splitter BS1, the lights were deflected by the 145-element piezoelectric ceramic transducer (PZT) deformable mirror (DM) and a series of relay optics (SM1-4; M2-4) for matching the 6 mm diameter of the eye pupil with the 6.5 mm diameter of the Hartmann wavefront sensor (HS)’s pupil without introducing additional chromatic aberration in the system, and were deflected into the eye by a reflecting mirror M1. In the observation path, the reflected lights from the eye fundus passed along the reverse optical path to BS1. Then they were reflected by BS3, passed through L1, and separated by BS4; two wavelengths were imaged on two cameras, respectively and simultaneously. Fundus cameras were placed in the focal plane of L1. In the wavefront sensing path, the filter F only made the near-infrared light pass in the TCA measurement. The near-infrared wavefront slope data measured by HS was processed to reconstruct the wavefront. The direct slope control algorithm was used to drive the DM to correct monochromatic wavefront aberrations in a closed loop in real-time. HS, DM, and computer control programs comprised the AO system.
Sign up for Chinese Optics Letters TOC. Get the latest issue of Chinese Optics Letters delivered right to you!Sign up now
The application of double-pass technology is advancement in the measurements of monochromatic aberration of the human eye. When the double-pass system is employed in TCA experiments, the phenomenon of chromatic aberration cancellation[14,15] cannot be ignored as the double-pass imaging process features autocorrelation. The TCA is cancelled by the second-pass optic path, when the light passes through the eye’s optical system. The entrance and exit pupil sizes can be made unequal to avoid the cancellation[16]. In the system, the artificial entrance pupil AP1 was a 6 mm diameter aperture with its central 1.5 mm obscured to avoid corneal reflection, and the artificial exit pupil AP2 was a 6 mm diameter aperture. Furthermore, the entrance and exit pupils have different sizes to retain the odd aberration information. The defocus of the human eye before experiment reduced the DM correction pressure. The subject was looking at a fixation screen to adjust the visual field angle between visual axis and measurement axis.
Before the experiment, the measurement system was calibrated with standard parallel light sources. The calibrated positions of the fundus cameras were expressed in and .
The PSF images for the two wavelengths were collected simultaneously by different fundus cameras. The horizontal TCA can be calculated by the expression[11]where is the TCA expressed in arcmin; is the PSF centroid position of the red light, is the PSF centroid position of the near-infared light; is the focal length of the lens L1 in front of fundus cameras (Fig. 3). Similarly, the vertical TCA can be obtained.
The computer converts the wavefront information collected by HS into Zernike polynomials: ; the LCA can be calculated by the expression[17]where is the LCA expressed in diopter, is the red light’s defocus, is the near-infrared light’s defocus, is the red light’s defocus (in micrometers), is the near–infrared light’s defocus (in micrometers), and R is the pupil radius (in millimeters).
A model eye with distinct TCA was employed to verify the feasibility of the chromatic measurement method[18]. The subjects had no previous history of ocular surgery or trauma and had corrected vision. In order to avoid a constriction of the human eye pupil, paralysis of accommodation and dilation of pupil were achieved with 1% cyclopentolate. Informed consents were obtained from all subjects. The power levels of the LDs at the pupil were smaller than 30 µW during the experiment, which was well below the maximum permissible exposure (red: 283.4 μW; near-infrared: 333.5 μW) for a continuous viewing established by the American National Standards Institute[19].
In order to obtain clear PSF images, an AO system that corrected the monochromatic aberration was introduced. After correcting the monochromatic aberration, the PSFs were close to the diffraction-limited PSF. The half-width at half-maximum (HWHM) of the measured PSFs was 1.13 to 1.30 times larger than the width expected from diffraction alone[13]. The PSF images in Fig. 4 showed the ability of this measurement system to achieve the TCA measurement.
Figure 4.Typical PSF images measured at the fovea for the right eyes of five subjects (CH, HSY, ZZ, WZT, and WSQ with aberrations corrected) in red (second line) and near-infrared (first line) wavelengths and the TCA was calculated from PSF images.
The TCAs between 639 nm and 795 nm for five subjects across the visual field were presented in Fig. 5 and Table 1. The PSF images were collected by the fundus cameras simultaneously in 10 s (20 ms per frame). The untrusted data, affected by blinks, were removed. The absolute magnitude of the ocular TCA varied between subjects. The horizontal TCA data of five subjects in Fig. 4 was linear fitted, where the slope expressed the rate of change in the horizontal TCA with eccentricity. The average slope of the horizontal TCA was 0.162 arcmin/degree. Along the visual axis (0°), the horizontal TCA was from 0.088 to 1.044 arcmin. The highest magnitude of horizontal TCA occurred in the nasal visual field from 0.598 to 3.482 arcmin. The lowest magnitude of the horizontal TCA occurred in the temporal visual field, where achromatic axis existed. The magnitude of TCA in vertical direction was small and floated around 0 arcmin from to 0.488 arcmin.
Figure 5.TCA in the horizontal meridian for five subjects (A: CH, B: HSY, C: ZZ, D: WZT, E: WSQ). The red squares represent the mean horizontal TCA (hTCA) for each measurement position, while the error bars represent the standard deviations. The red line represents the fitting of the hTCA. The blue circles represent the mean vertical TCA (vTCA). The coordinate expressed the angle between the visual axis and the measured axis in degrees. The nasal side is negative; the temporal is positive.
In Ref. [10], the visual axis TCA between 497 nm and 605 nm was in the range of 0.05 arcmin to 2.67 arcmin. TCA measurement results at visual axis (0°) were mainly in the range of those in Ref. [10], which confirmed the reliability of our TCA measurement results. The relationship between the TCA and spectral range was found by comparing the results of our study with earlier studies. Thibos[20] obtained the change of TCA with eccentricity to be 0.28 arcmin/degree for the spectral range of 430 nm to 770 nm in his eye model (compared with TCA in this Letter, which was 0.162 arcmin/degree for the spectral range of 639 nm to 795 nm). TCA was not linear with the change of spectral ranges. In fact, the TCA change with eccentricity in the short spectral range was faster than in the long spectral range[21].
The LCA across the visual field was also measured in this system. The individual LCA is relatively stable; hence, the LCA measurement does not need to be strictly simultaneous. Wavefronts of two wavelengths over the visual field were obtained by HS at different time moments in the measurement system that removed the filter F in front of HS. The wavefronts were converted into Zernike polynomials, while the Zernike defocus coefficient was used to calculate the LCA [use Eq. (2)].
Measurement results of LCA are shown in Fig. 6 and Table 2. The LCA changed with eccentricity. The lowest magnitude of LCA occurred near the optic axis of eye (5°); average value of LCA was D. LCA was smaller close to the optic axis. For the eccentricity ranging from 5° to , the LCA increased from D to D. Previous studies employed different spectral ranges and conditions. It was challenging to compare the measurement results directly; the magnitude of the LCA needs to be recalculated for the same spectral ranges. The LCA results can be compared with Cauchy’s equation[22]. where is the LCA between and 590 nm. The LCA calculated between 639 nm and 795 nm on visual axis was 0.447 D, compared with our results D on the visual axis. Cauchy’s equation is based on psychophysical measurement data. Vines et al.[7] indicated that the psychophysically measured LCA was significantly higher than the value obtained objectively using HS techniques. Our measurement results and the calculated results of LCA were consistent with this phenomenon ( D in objective measurement and 0.447 D in psychophysical measurement).
Figure 6.LCA in the horizontal meridian for three subjects: black squares (CH), red circles (ZZ), and blue triangles (WZT). The x coordinate expressed the angle between the visual axis and the measured axis in degrees. The nasal side is negative; the temporal is positive.
In conclusion, a simple method to objectively and simultaneously measure an eye’s TCA and LCA aberrations was proposed. Regarding clinical applications, the chromatic aberration data could optimize the design of IOL. For fundus photography applications, the measured chromatic aberration data can be employed to compensate the multiwavelengths image chromatic aberrations of the eye in real time. This technique can also be employed to evaluate the chromatic aberration of a lens[23]. This Letter demonstrated the feasibility of a chromatic aberration measurement method. Limited by the range of HS, it can only measure chromatic aberration around a 20° visual field of the human eye. Future research will be based on the application to measure the corresponding spectral range in practical applications and solve the problem of measurement range limitation.
References
[1] L. N. Thibos. Frontiers in Optics, FTu4G.1(2012).
[17] J. Porter, H. M. Queener, J. E. Lin, K. Thorn, A. Awwal. Adaptive Optics for Vision Science Principles, Practices, Design, and Applications, 272(2005).
Yangchun Deng, Junlei Zhao, Yun Dai, Yudong Zhang, "Objective quantification of chromatic aberration across the visual field of the human eye," Chin. Opt. Lett. 16, 113301 (2018)