
Zhijun Zheng, Lingyan Mao, Zhihao Dong. Effect of Microstructural Anisotropy on Corrosion Resistance of 316L Stainless Steel Prepared by Additive Manufacturing[J]. Chinese Journal of Lasers, 2023, 50(4): 0402012
- Chinese Journal of Lasers
- Vol. 50, Issue 4, 0402012 (2023)
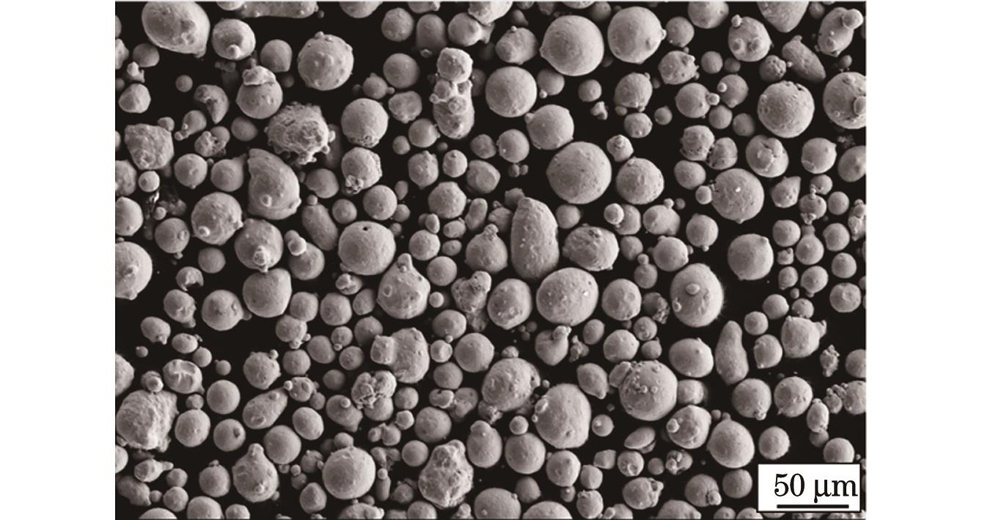
Fig. 1. Morphology of 316L stainless steel powder
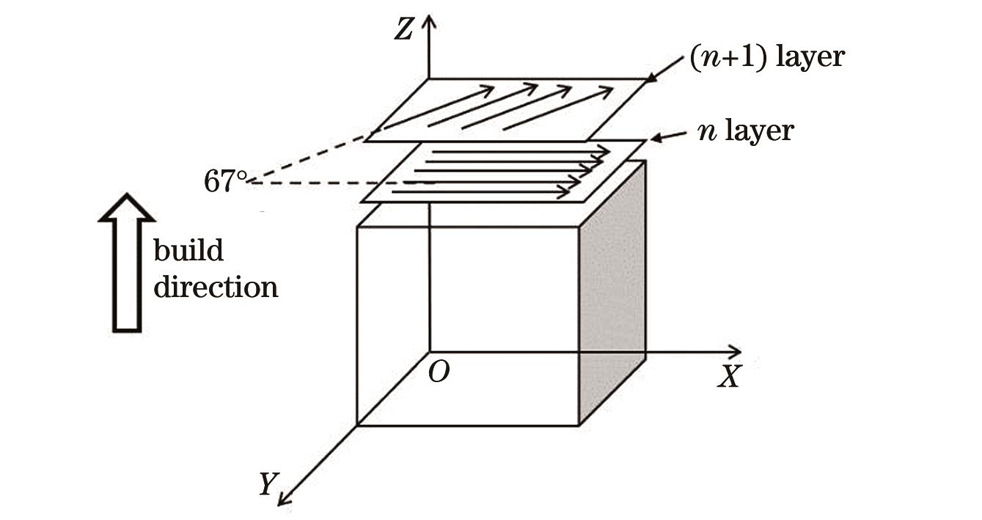
Fig. 2. Schematic of sample printing direction and scanning strategy
Fig. 3. Schematics of sample cutting. (a) XOY plane; (b) YOZ plane
Fig. 4. Metallographic diagrams after coloring treatment. (a) XOY plane; (b) YOZ plane
Fig. 5. XRD patterns of SLMed and forged 316L SS samples
Fig. 6. SEM microstructures of SLMed 316L SS. (a) XOY plane; (b) YOZ plane
Fig. 7. EBSD diagrams and inverse pole diagrams of 3D printed parts
Fig. 8. Grain size distributions in SLMed 316L SS. (a) XOY plane; (b) YOZ plane
Fig. 9. OCP curves of SLMed and forged 316L SS specimens in H2SO4 solution
Fig. 10. Potentiodynamic polarization curves of forged and SLMed 316L SS specimens in H2SO4 solution
Fig. 11. Impedance spectra of forged and SLMed 316L SS specimens in H2SO4 solution
Fig. 12. Electrostatic potential plots of forged and SLMed 316L SS specimens in H2SO4 solution
Fig. 13. SEM morphologies of surface after sample corrosion. (a) SLMed sample on XOY plane; (b) SLMed sample on YOZ plane; (c) forged sample
|
Table 1. Chemical compositions of 316L stainless steel powder
|
Table 2. Planar densities of SLMed 316L SS on different planes
| ||||||||||||||||||
Table 4. Corrosion parameters of forged and SLMed 316L SS specimens in H2SO4 solution
|
Table 5. EDS analysis results for impurities in samples


Set citation alerts for the article
Please enter your email address

© Copyright 2018-2021 | Chinese Laser Press. All Rights Reserved 沪ICP备15018463号-20