
Dewei Deng, Qinghua Fan, Xianglu Zhao, Yushan Ma, Zhiye Huang, Qi Sun, Shuhua Yang, Yong Zhang. Influence of Processing Parameters on Surface Roughness for Laser Cleaning of FV520B Steel Oxide Layer[J]. Laser & Optoelectronics Progress, 2021, 58(21): 2114005
- Laser & Optoelectronics Progress
- Vol. 58, Issue 21, 2114005 (2021)
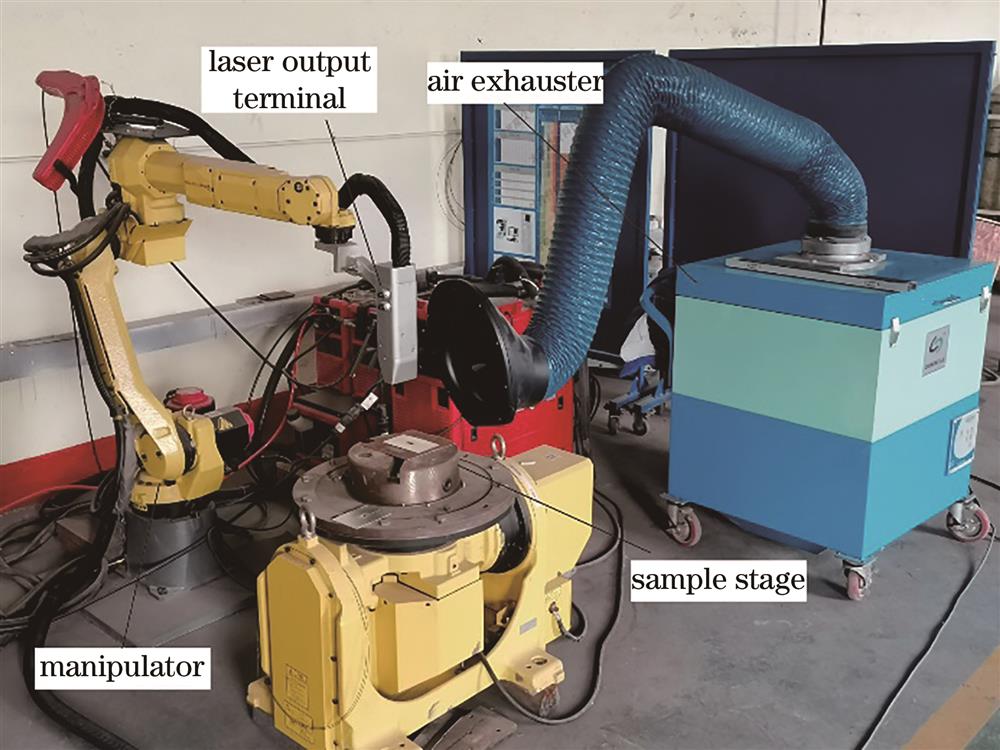
Fig. 1. Laser cleaning equipment
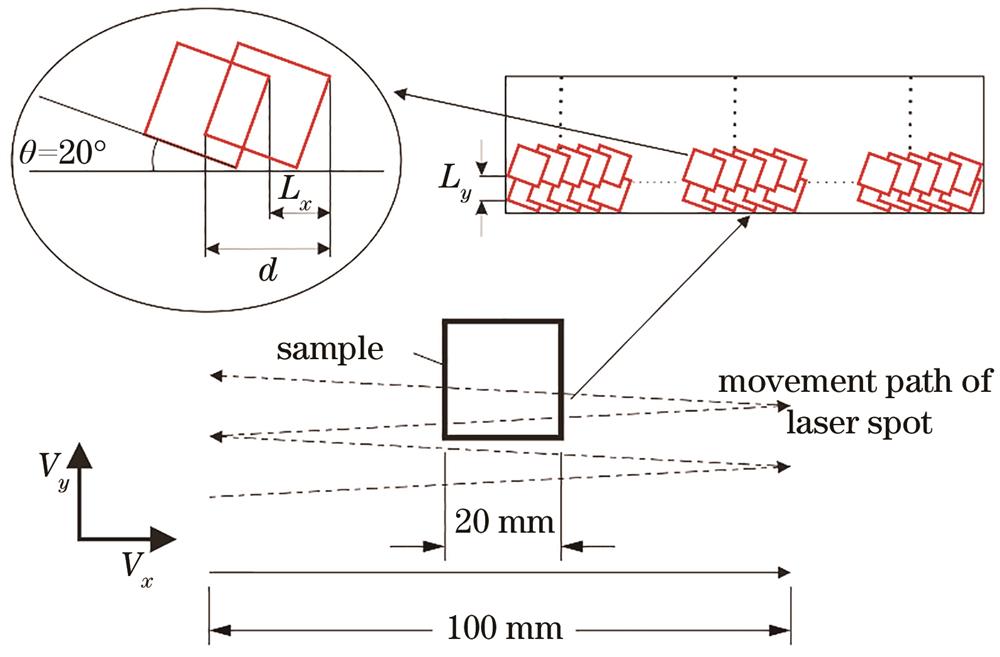
Fig. 2. Schematic of laser scanning path and spot overlap
Fig. 3. XPS full spectrum of FV520B steel oxide layer sample
Fig. 4. Element contents of FV520B steel oxide layer sample prepared by polishing
Fig. 5. Roughness of prepared FV520B steel samples with and without oxide layer for different abrasive papers
Fig. 6. Roughness of FV520B steel oxide layer sample after cleaning when frequency is 20 kHz
Fig. 7. Surface morphologies of FV520B steel oxide layer samples before and after laser cleaning for different powers. (a) Before cleaning; (b) cleaning with power of 40 W; (c) cleaning with power of 80 W; (d) cleaning with power of 120 W; (e) cleaning with power of 160 W; (f) cleaning with power of 200 W
Fig. 8. SEM images of FV520B steel oxide layer samples after laser cleaning with different laser powers when pulse frequency is 20 kHz. (a) 40 W; (b) 80 W; (c) 120 W; (d) 160 W; (e) 200 W
Fig. 9. Surface morphologies of FV520B steel oxide layer samples after one time laser cleaning at different frequencies when laser power is 120 W. (a) 20 kHz; (b) 30 kHz;(c) 40 kHz; (d) 50 kHz
Fig. 10. Roughness of FV520B steel oxide layer sample after one time laser cleaning at different frequencies when laser power is 120 W
Fig. 11. Roughness of FV520B steel oxide layer sample after laser cleaning for different cleaning times when laser power is 120 W and pulse frequency is 20 kHz
Fig. 12. SEM images of oxide layer samples after laser cleaning with laser power of 120 W and pulse frequency of 20 kHz for different cleaning times. (a) One time; (b) two times; (c) three times; (d) four times; (e) five times; (f) ten times; (g) locally magnified region in dotted box of Fig.12 (b)
Fig. 13. Schematic of laser cleaning for FV520B steel oxide layer sample with laser power of 120 W and pulse frequency of 20 kHz
Fig. 14. Roughness histograms of oxide layer samples prepared after polishing with different grades of abrasive papers and after laser cleaning with laser power of 120 W and pulse frequency of 20 kHz for one time or two times
Fig. 15. Surface morphologies of oxide layer samples prepared after polishing with different grades of abrasive papers and after one time laser cleaning with 120 W/20 kHz. (a) 200#; (b) 400#; (c) 600#; (d) 800#
|
Table 1. Device parameters
|
Table 2. Element contents of FV520B steel plate
|
Table 3. Experimental parameters


Set citation alerts for the article
Please enter your email address

© Copyright 2018-2021 | Chinese Laser Press. All Rights Reserved 沪ICP备15018463号-20